The last 24 hours in PHP land were a mess. Two critical RCEs in PHP core, proof-of-concepts doing the rounds before the fix was out, and a lot of sysadmins pulling the plug on their own sites rather than waiting to get popped.
At Oh Dear we monitor a lot of PHP sites, so we had a front row seat. I wrote up what we saw on the Oh Dear blog: The last 24 hours in PHP land, as observed by a monitoring service .
This is the graph that stood out the most:
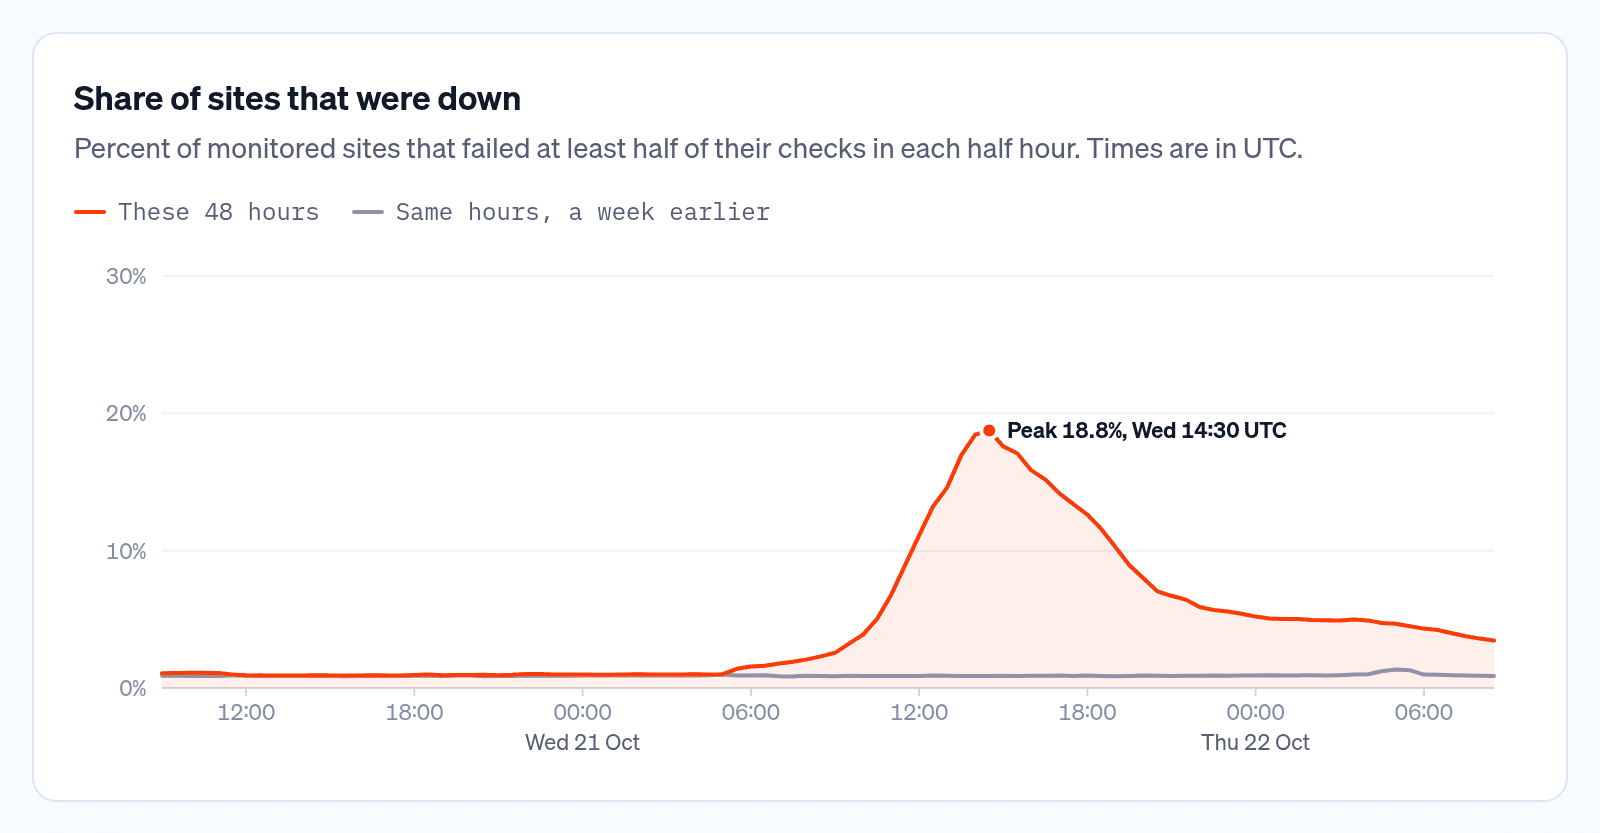
A normal day, about 0.9% of the sites we monitor are down. On Wednesday afternoon it was 18.8%. Almost 1 in 5 sites, offline at the same time.
The peak landed at 14:30 UTC, an hour after PHP released the fix. That makes sense when you look at the package timeline
: Ubuntu’s fix was installable with apt at 14:50 UTC, Debian 12 at 16:13, the official Docker images at 17:40, … You can’t bring a site back up until you have something to install.
The Oh Dear post has more graphs: how the sites went down (mostly HTTP/503 or no answer at all), how long the outages lasted, and who served all those 503 pages (Cloudflare, mostly). Go read the full post .
If your site is still in maintenance mode, the patch instructions
have the steps per distribution. The early mitigations
are only a stopgap, and PHP’s new memory_hard_limit_percent setting
changes how memory_limit behaves once you’re on the patched version.