We watch websites for a living at Oh Dear , which puts us in a unique position: we have data on a lot of different outages.
We took ten months of monitoring, 1,817,403 real outages across tens of thousands of sites, and put it on one page: The State of Website Uptime . It’s aggregate, anonymized, and we’ll refresh it every year at the same address.
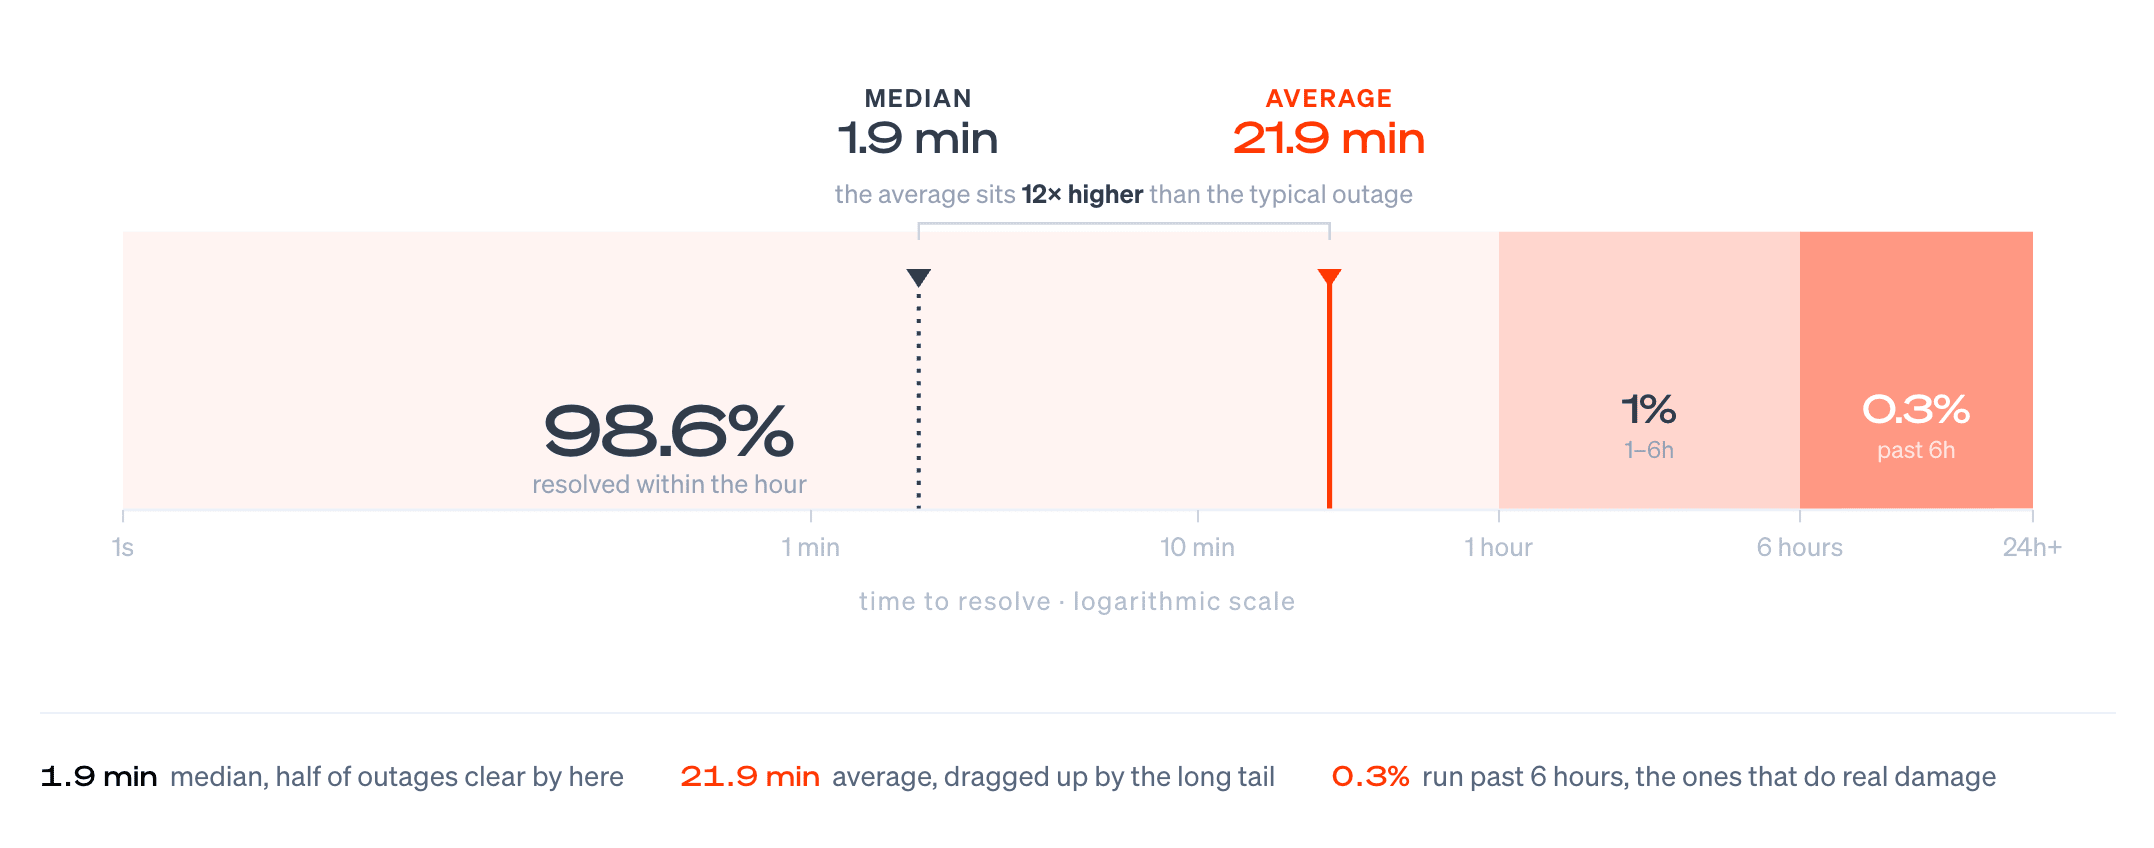
Downtime reaches almost everyone, but most of it is harmless. 61.4% of monitored sites went down at least once, yet the median outage clears in 1.9 minutes and 98.6% are back within the hour. The pain is in the tail: the 0.3% of outages that run past six hours. That tail is the only reason the average outage (21.9 minutes) sits 12x above the median.
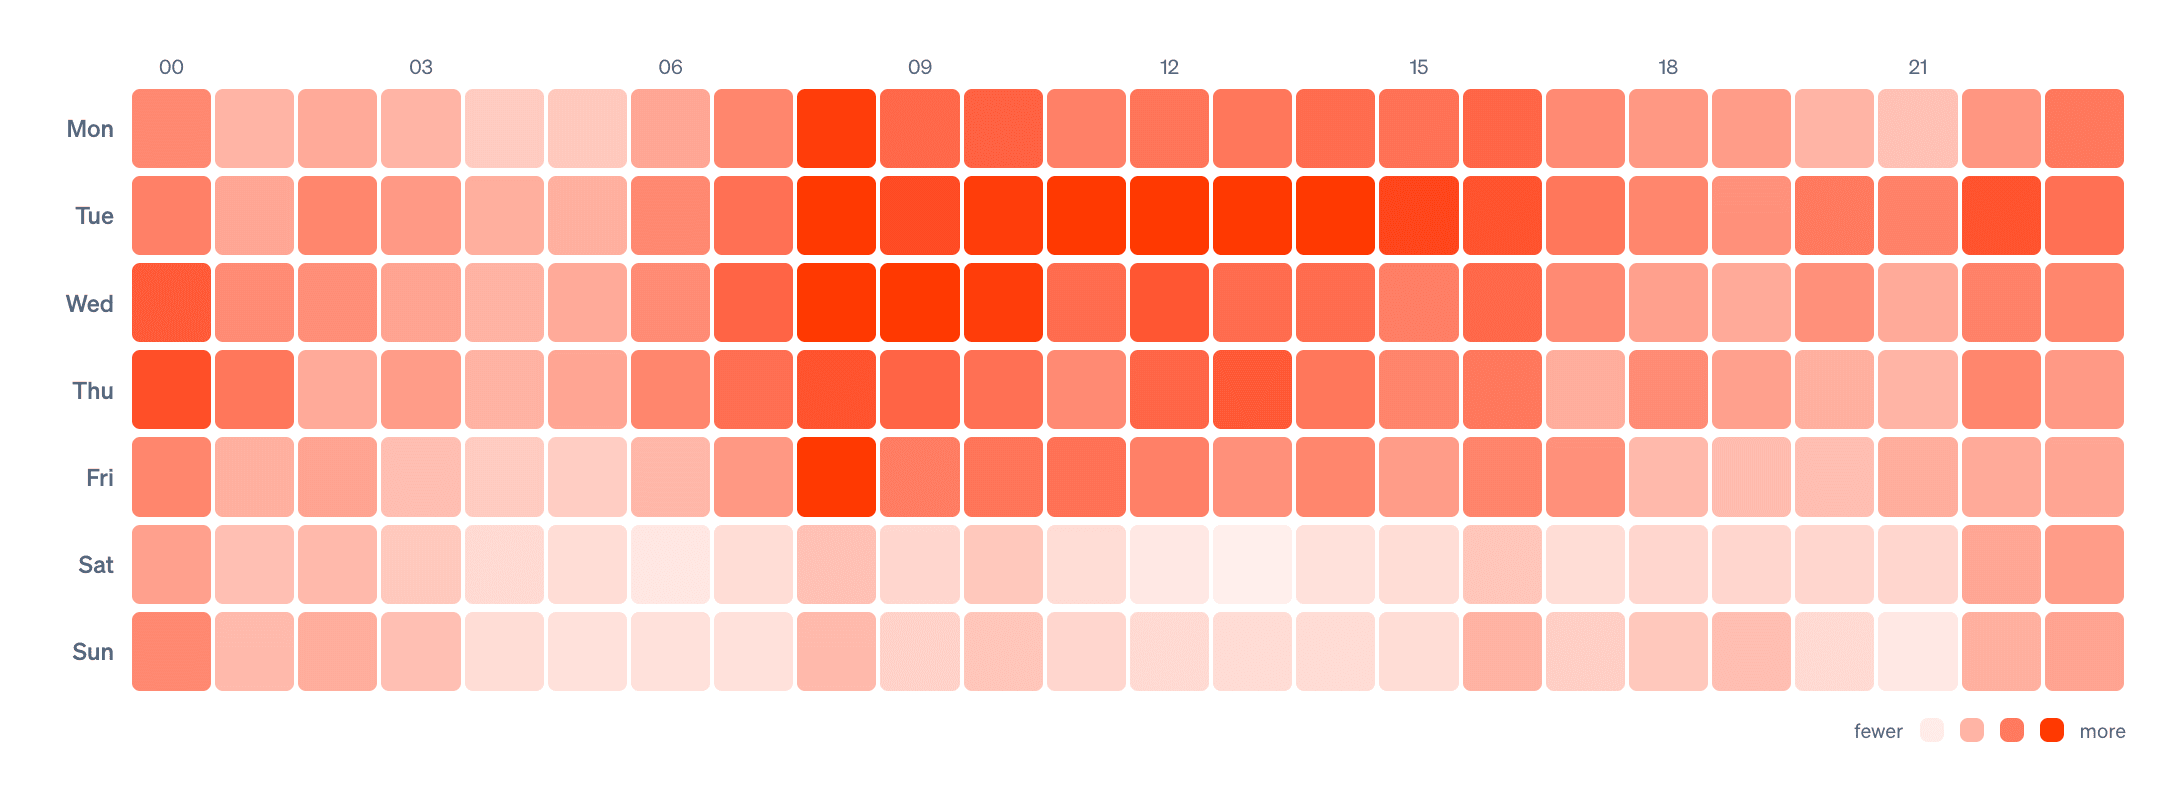
Most outages don’t wait for office hours either. Two-thirds (67.7%) start outside the 9-to-6 workday, on weeknights and weekends, and the volume barely dips overnight. The average site lands about 32 of those a year on someone’s evening.
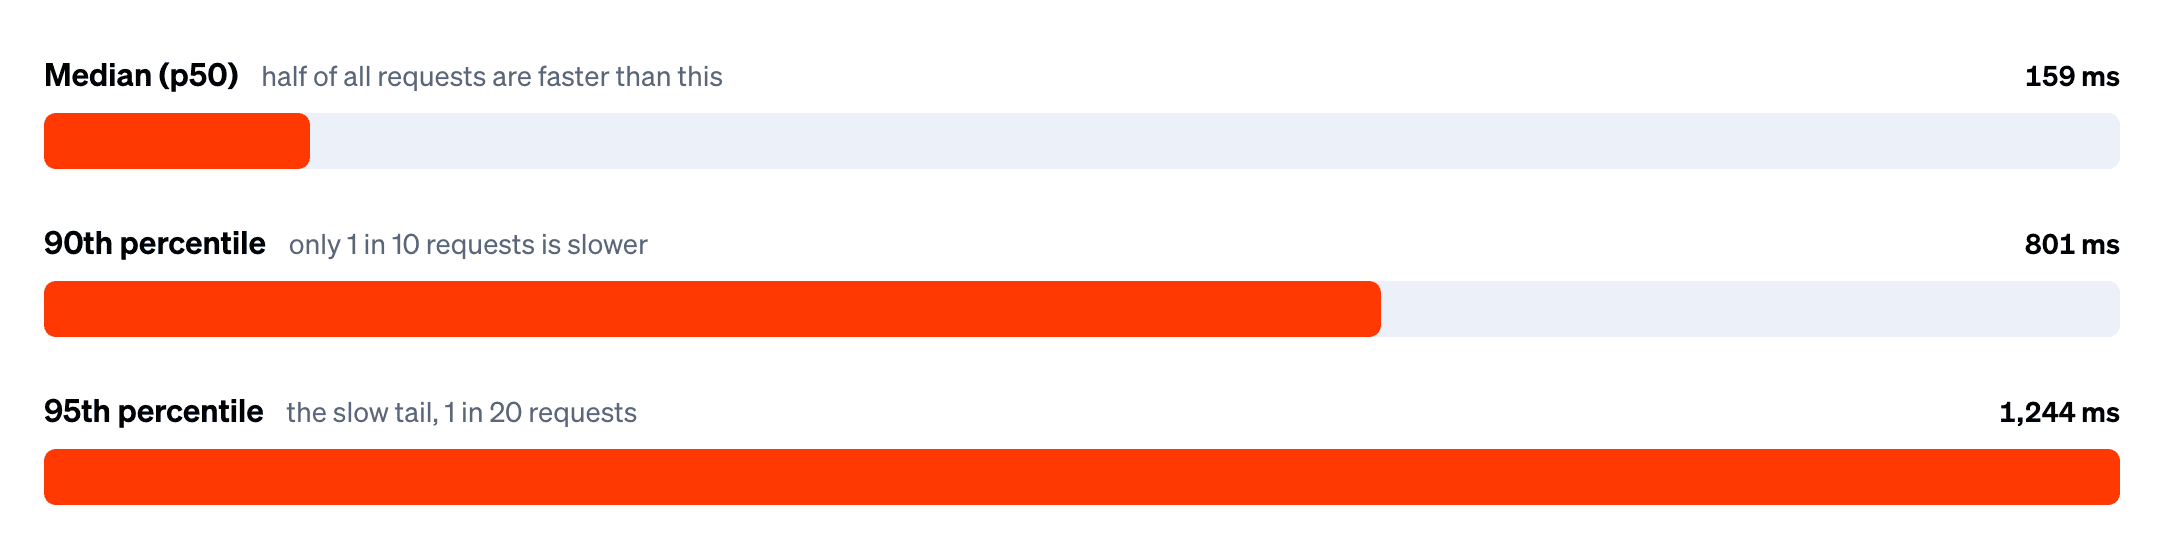
A site can be up and still feel slow. The median full response across every HTTP site we monitor (DNS, connection, TLS, server processing, and download combined) is 159ms, but the slow tenth is where visitors feel it: 801ms at the 90th percentile, 1,244ms at the 95th.
There’s plenty more I skipped in this post: Lighthouse scores where the same sites manage 78 on desktop and 57 on mobile, what each “nine” of uptime costs you in hours per year, broken links, and expiring certificates.
Oh, and the cron numbers are grim: 23.3% of cron jobs failed or missed a run in the last 30 days. That’s the kind of failure you only catch if you’re watching for it. Go read the full breakdown ; that’s where all the juicy details are. 😉