CPU Flame Graphs

Want to help support this blog? Try out Oh Dear, the best all-in-one monitoring tool for your entire website, co-founded by me (the guy that wrote this blogpost). Start with a 10-day trial, no strings attached.

We offer uptime monitoring, SSL checks, broken links checking, performance & cronjob monitoring, branded status pages & so much more. Try us out today!

Profile image of Mattias Geniar

Mattias Geniar, November 23, 2014

Follow me on Twitter as @mattiasgeniar

I’ve only heard of CPU Flame Graphs since the article on NodeJS performance issues at Netflix.

… given a performance problem, observability is of the utmost importance. Flame graphs gave us tremendous insight into where our app was spending most of its time on CPU. I canโ€™t imagine how we would have solved this problem without being able to sample Node.js stacks and visualize them with flame graphs.Yunong Xiao @ Netflix

The source code is available on Github.

CPU Flame Graph

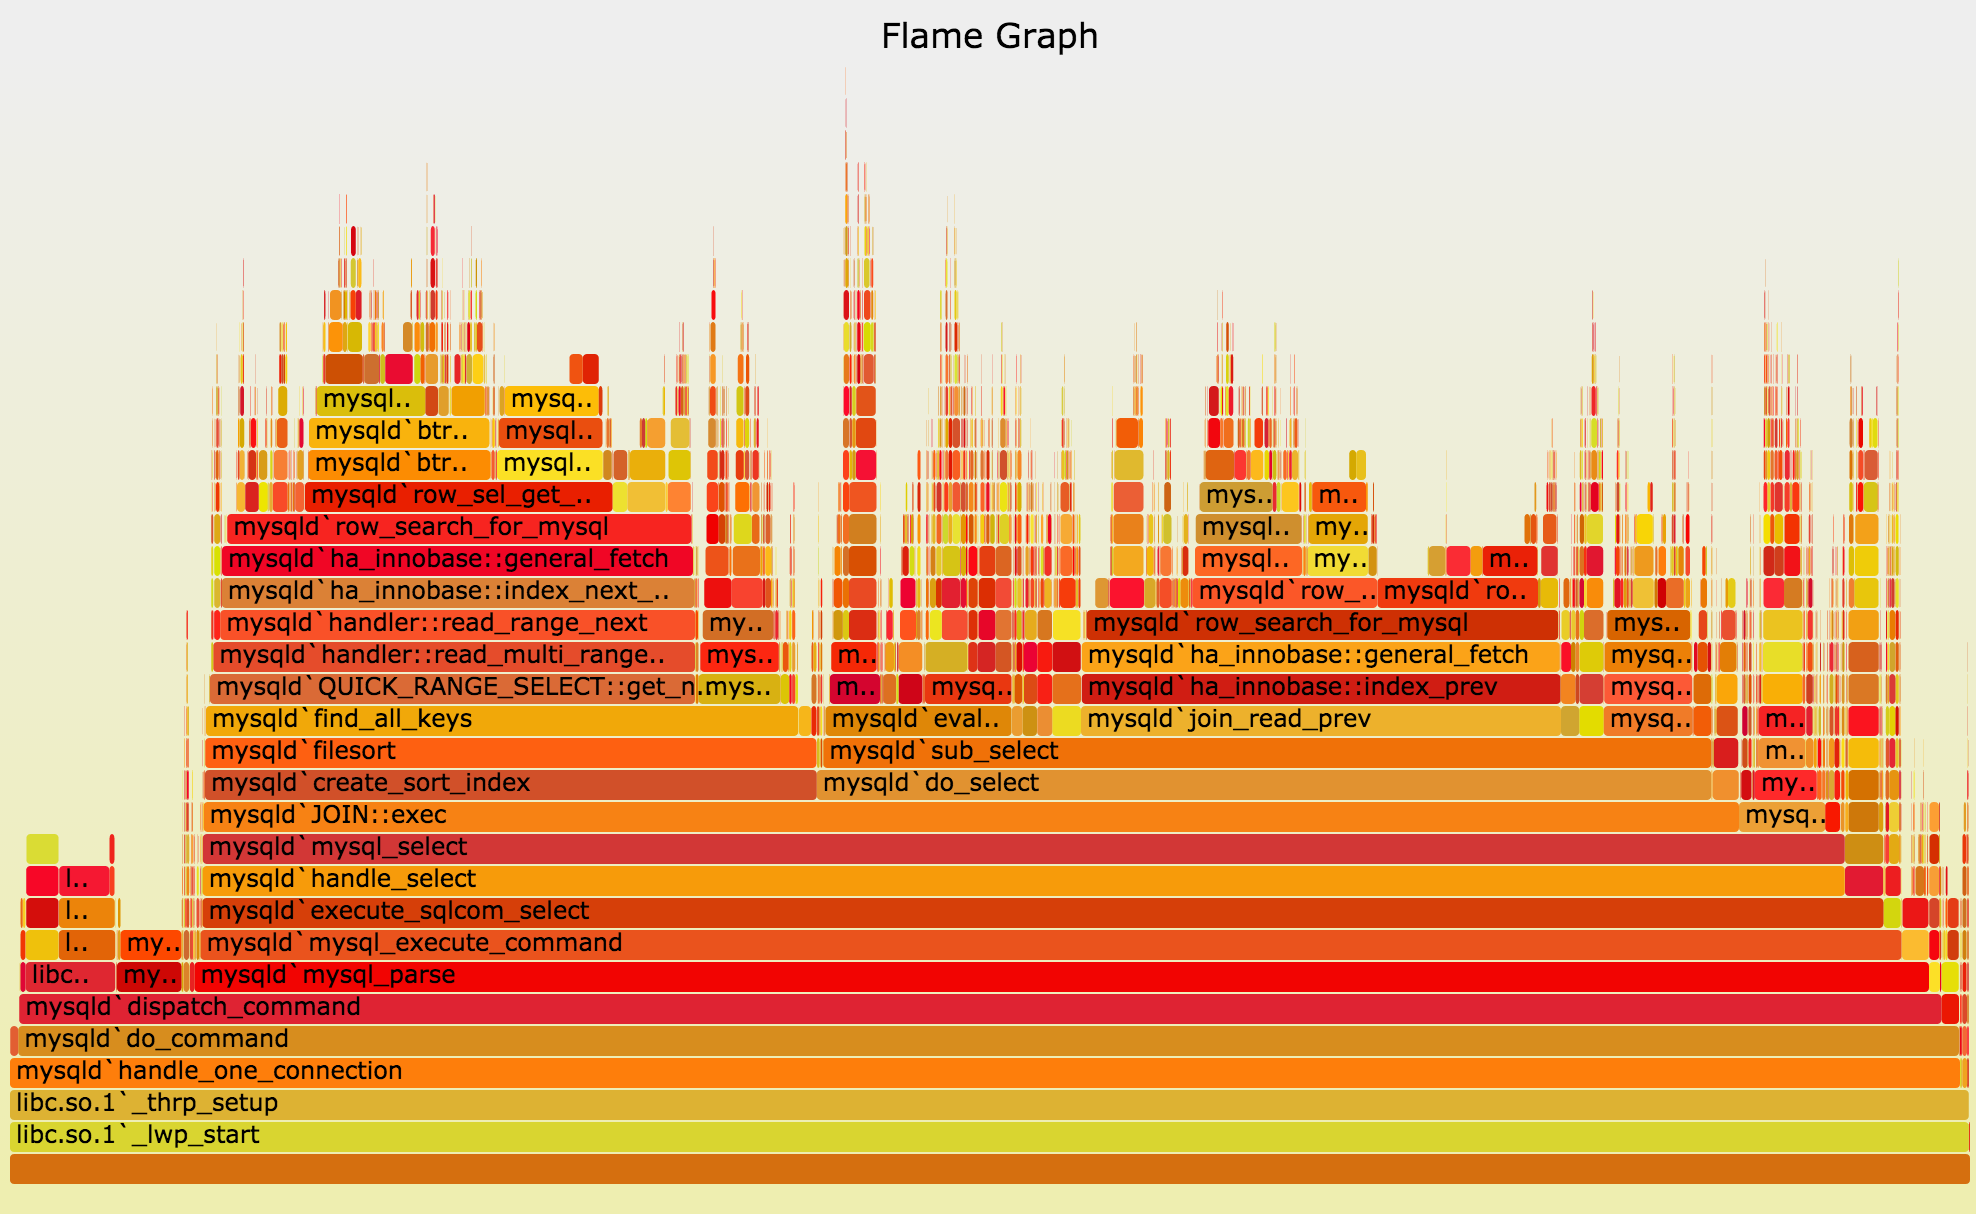
It uses DTrace (or perf_events, SystemTap, or ktap) to capture the kernel output and convert it into an SVG image for you to analyse (see an example here).

Now all I need is an excuse (and time) to use this!


Want to subscribe to the cron.weekly newsletter?

I write a weekly-ish newsletter on Linux, open source & webdevelopment called cron.weekly.

It features the latest news, guides & tutorials and new open source projects. You can sign up via email below.

No spam. Just some good, practical Linux & open source content.