Even after all these years, Zabbix remains my monitoring tool of choice. There’s plenty of alternatives, but years of investing in the configs, the templates and the automation have kept my love for it. But, it’s not always easy to keep this beast up-and-running, especially once you start to have a serious collection of hosts, items and triggers you’re monitoring.
But, since one of the latest 1.8 releases, Zabbix has support for internal items, to keep track of how the individual Zabbix processes are doing. In fact, since the 2.2 release, Zabbix also supports dynamic process names , that include the state and performance of each process.
But internal items are the focus here. You can add them in a template or directly on the host, chose the Zabbix Internal type, and you’re off.
You can use it to check the internal read and write caches of Zabbix, for instance.
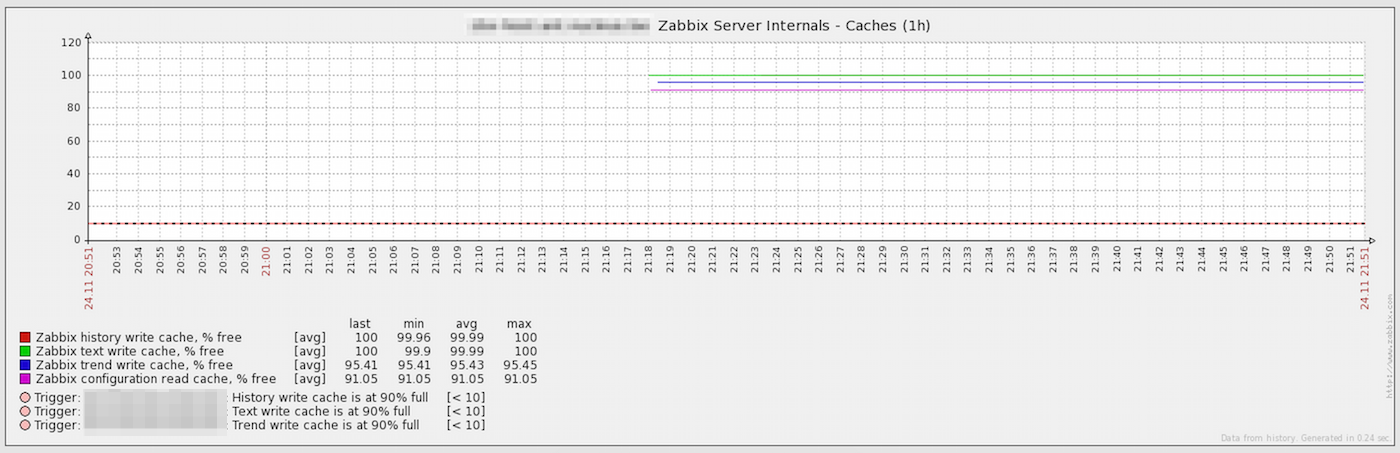
If the write caches always show a percentage free of less than 20%, it’ll indicate you have a database performance problem since it can’t keep up with all the data that needs to be written. If your DB still has I/O to spare, and you’ve tweaked your database all you can, you can always increase the StartDBSyncers parameter from the default 4 to a higher value – but be careful, as you can destroy your performance with a bad StartDBSyncers setting
. It’s how many Database-syncer processes the Zabbix Server will start. The history syncer internal process will at that point also be shown as 100%.
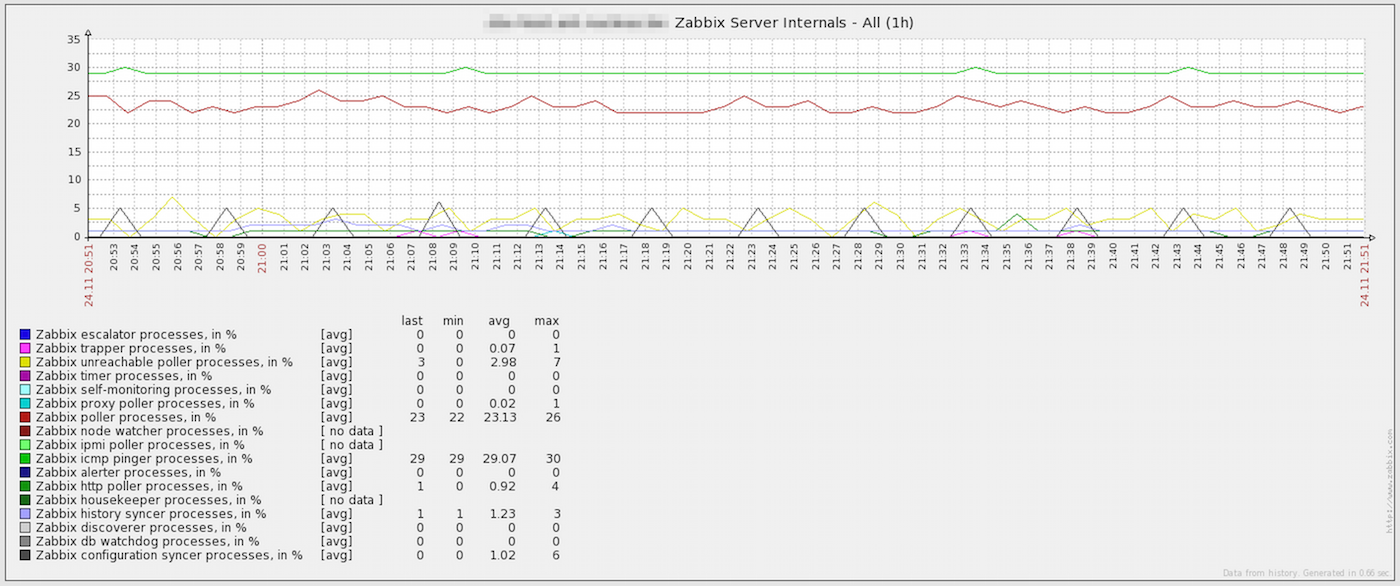
With the internal items, you can also poll the state of each of those individual processes of Zabbix, from the Housekeeper task to the ICMP pollers, the discoverer processes and the escalator processes.The internal checks cover it all.
They are very useful items to have from day one, with a long retention. It allows you to see how your Zabbix server performance has evolved over the months and years, and can help you pinpoint an exact time of a change that had a performance result. This isn’t new in Zabbix, in fact the Zabbix team blogged about it in 2011 , but not everyone has these items enabled with alerting triggers.