I couldn’t be prouder to showcase Oh Dear 2.0 , our all-in-one monitoring solution for websites. Over the past year, we’ve redesigned the entire service and have started implementing the designs. And now, it’s ready.
The images below show the old version first, followed by the new version.
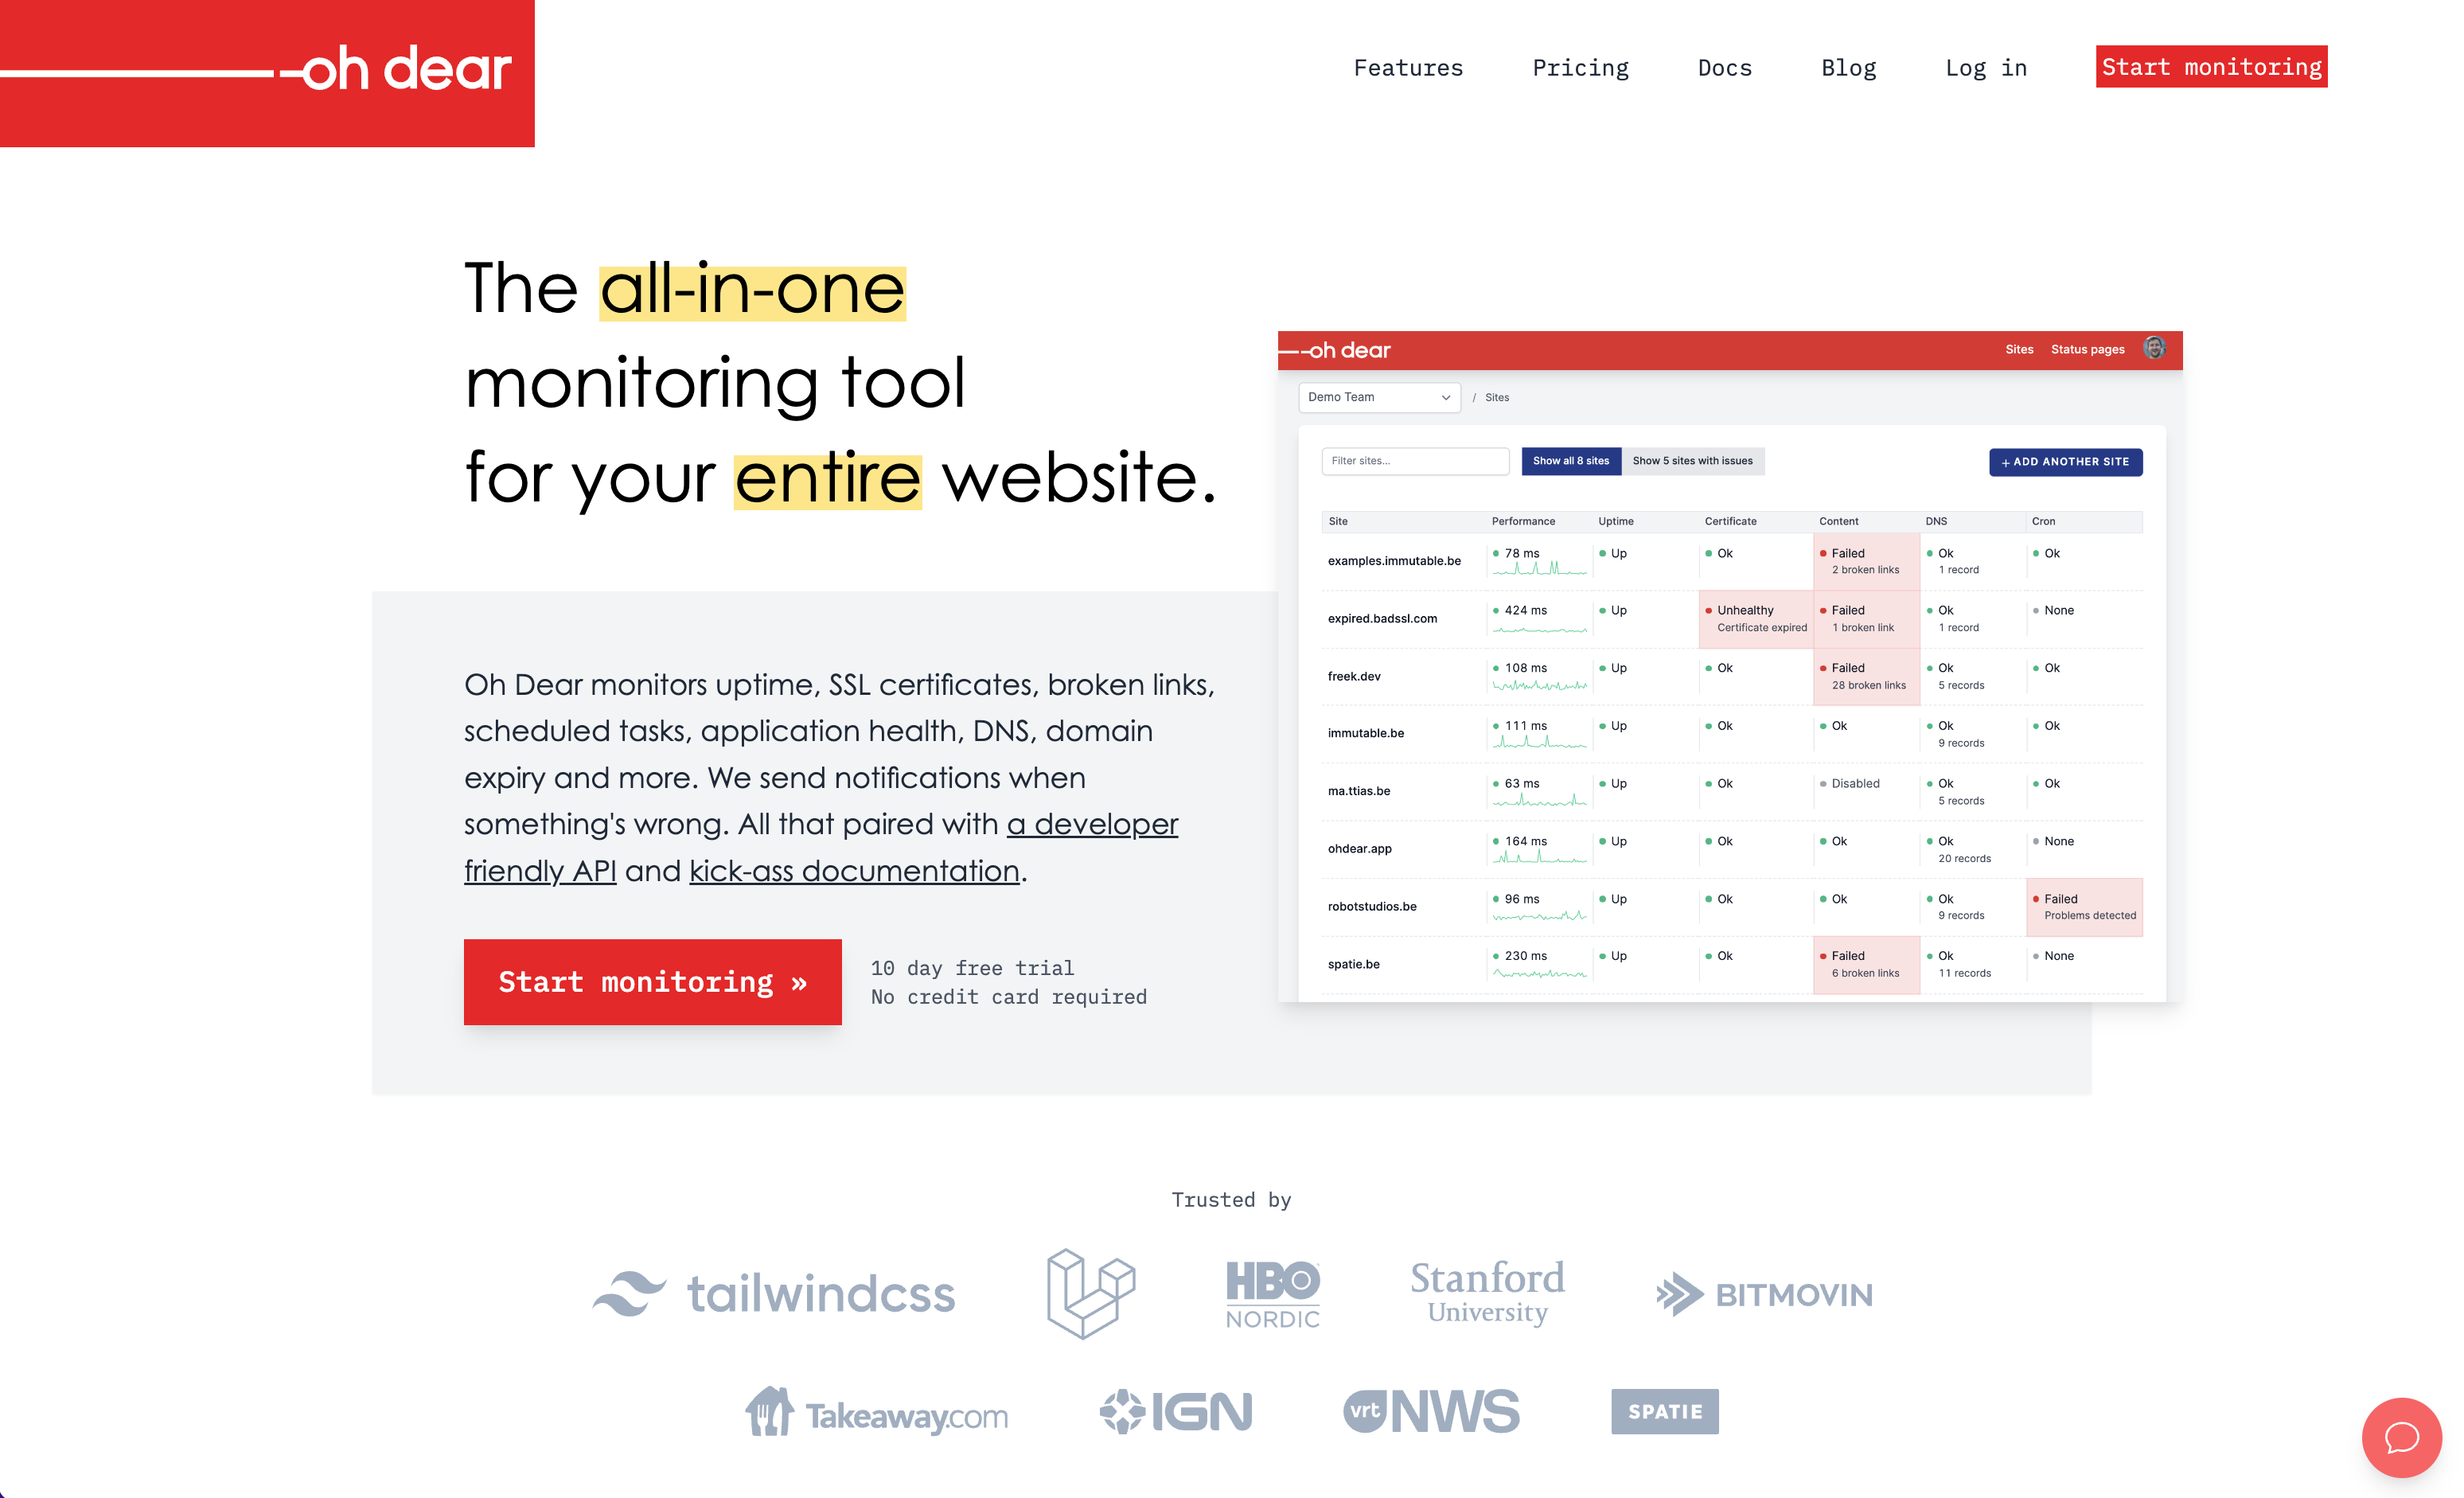
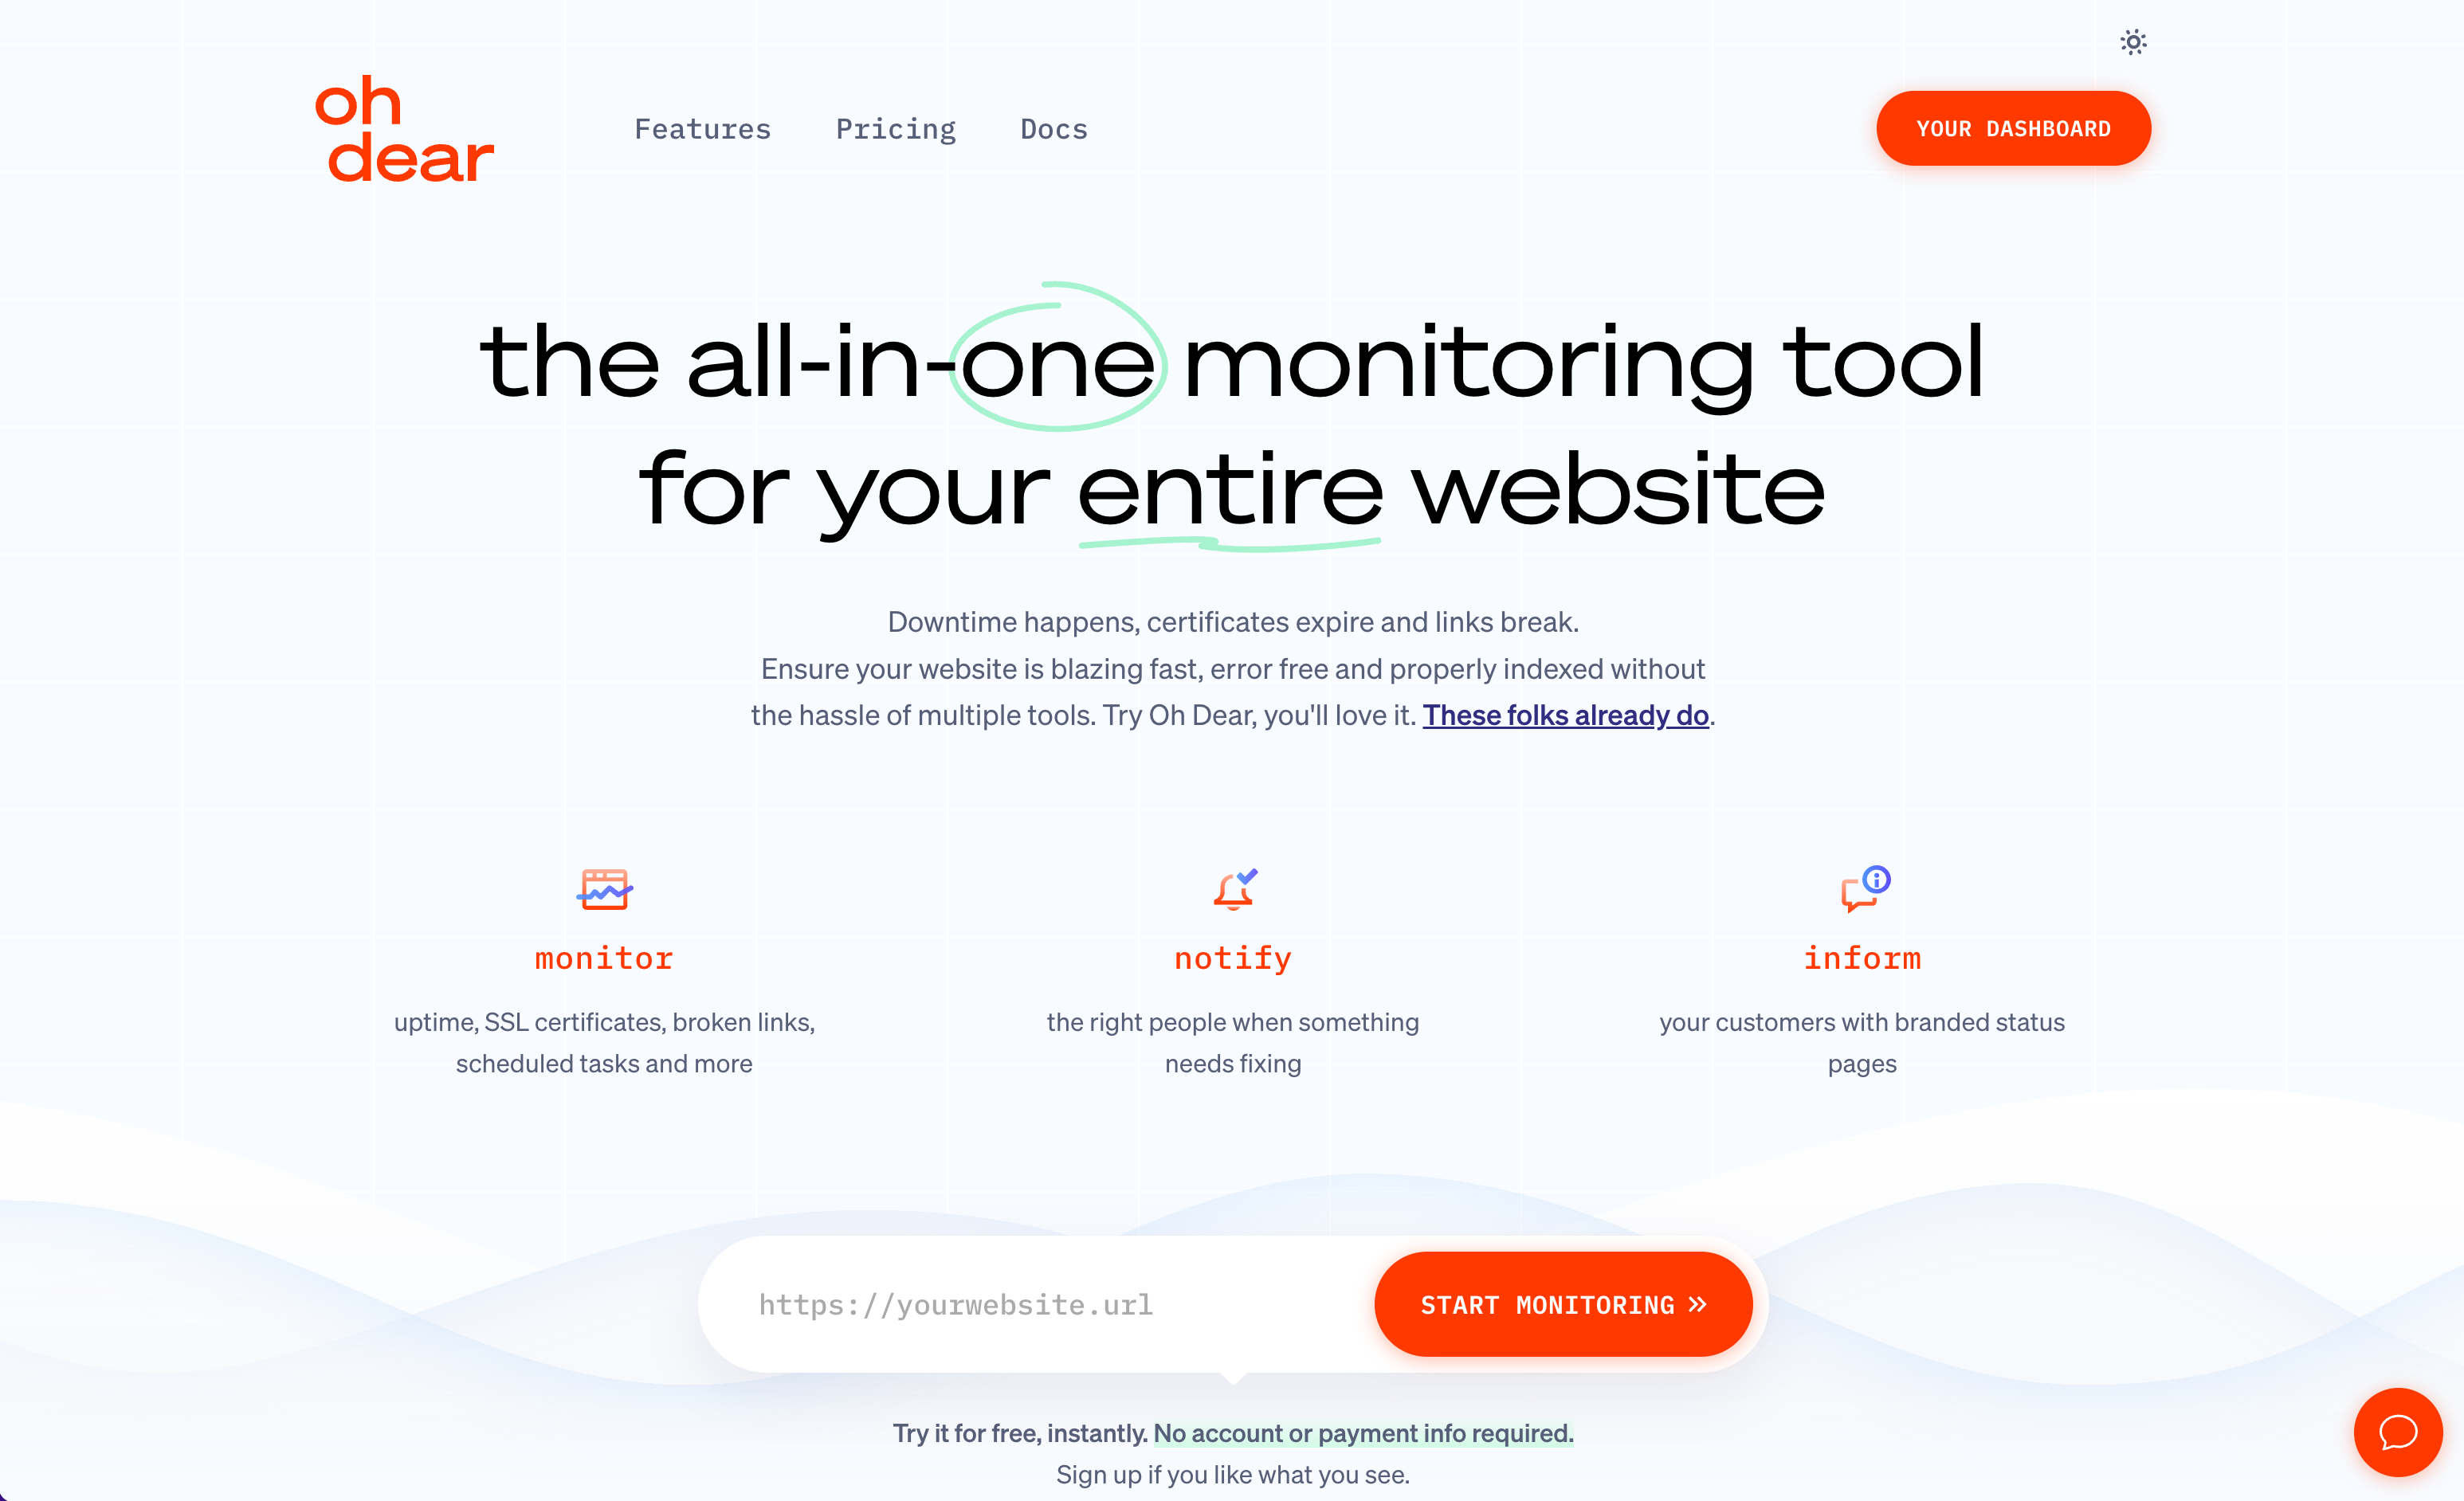
Our homepage#
First impressions matter, and I think we’ve made some good leaps forward here .
Old homepage:
New homepage:
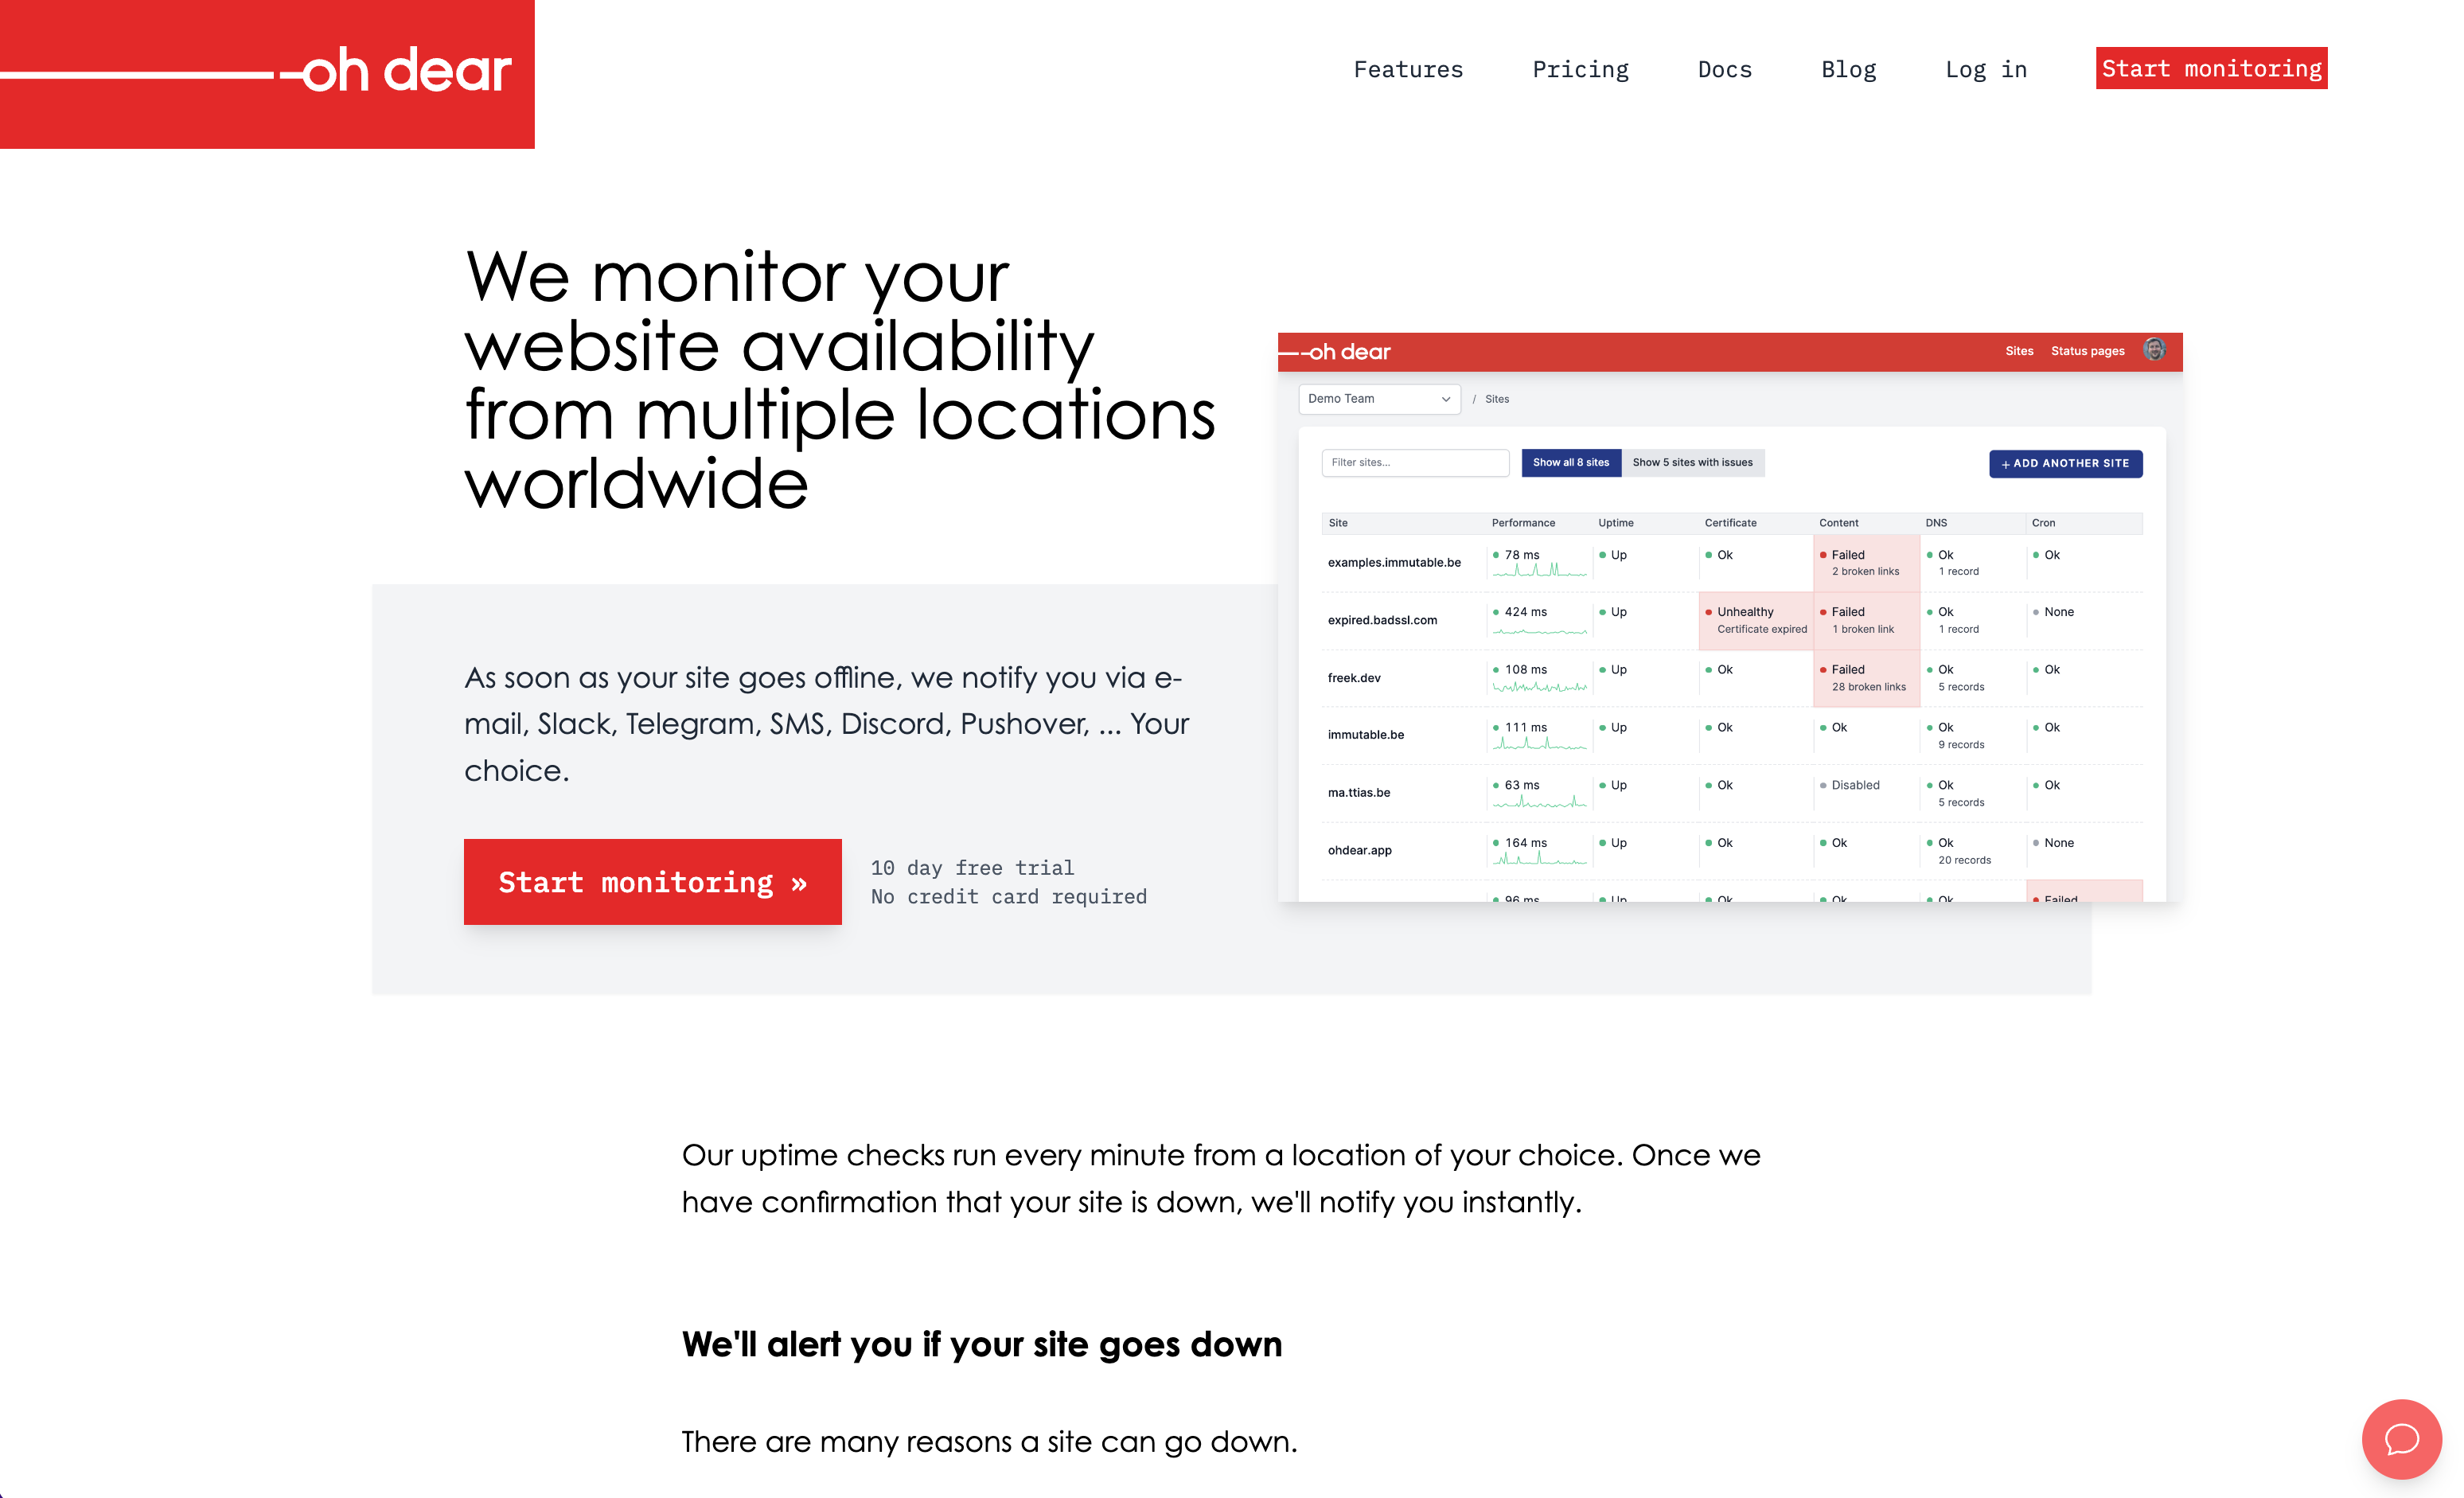
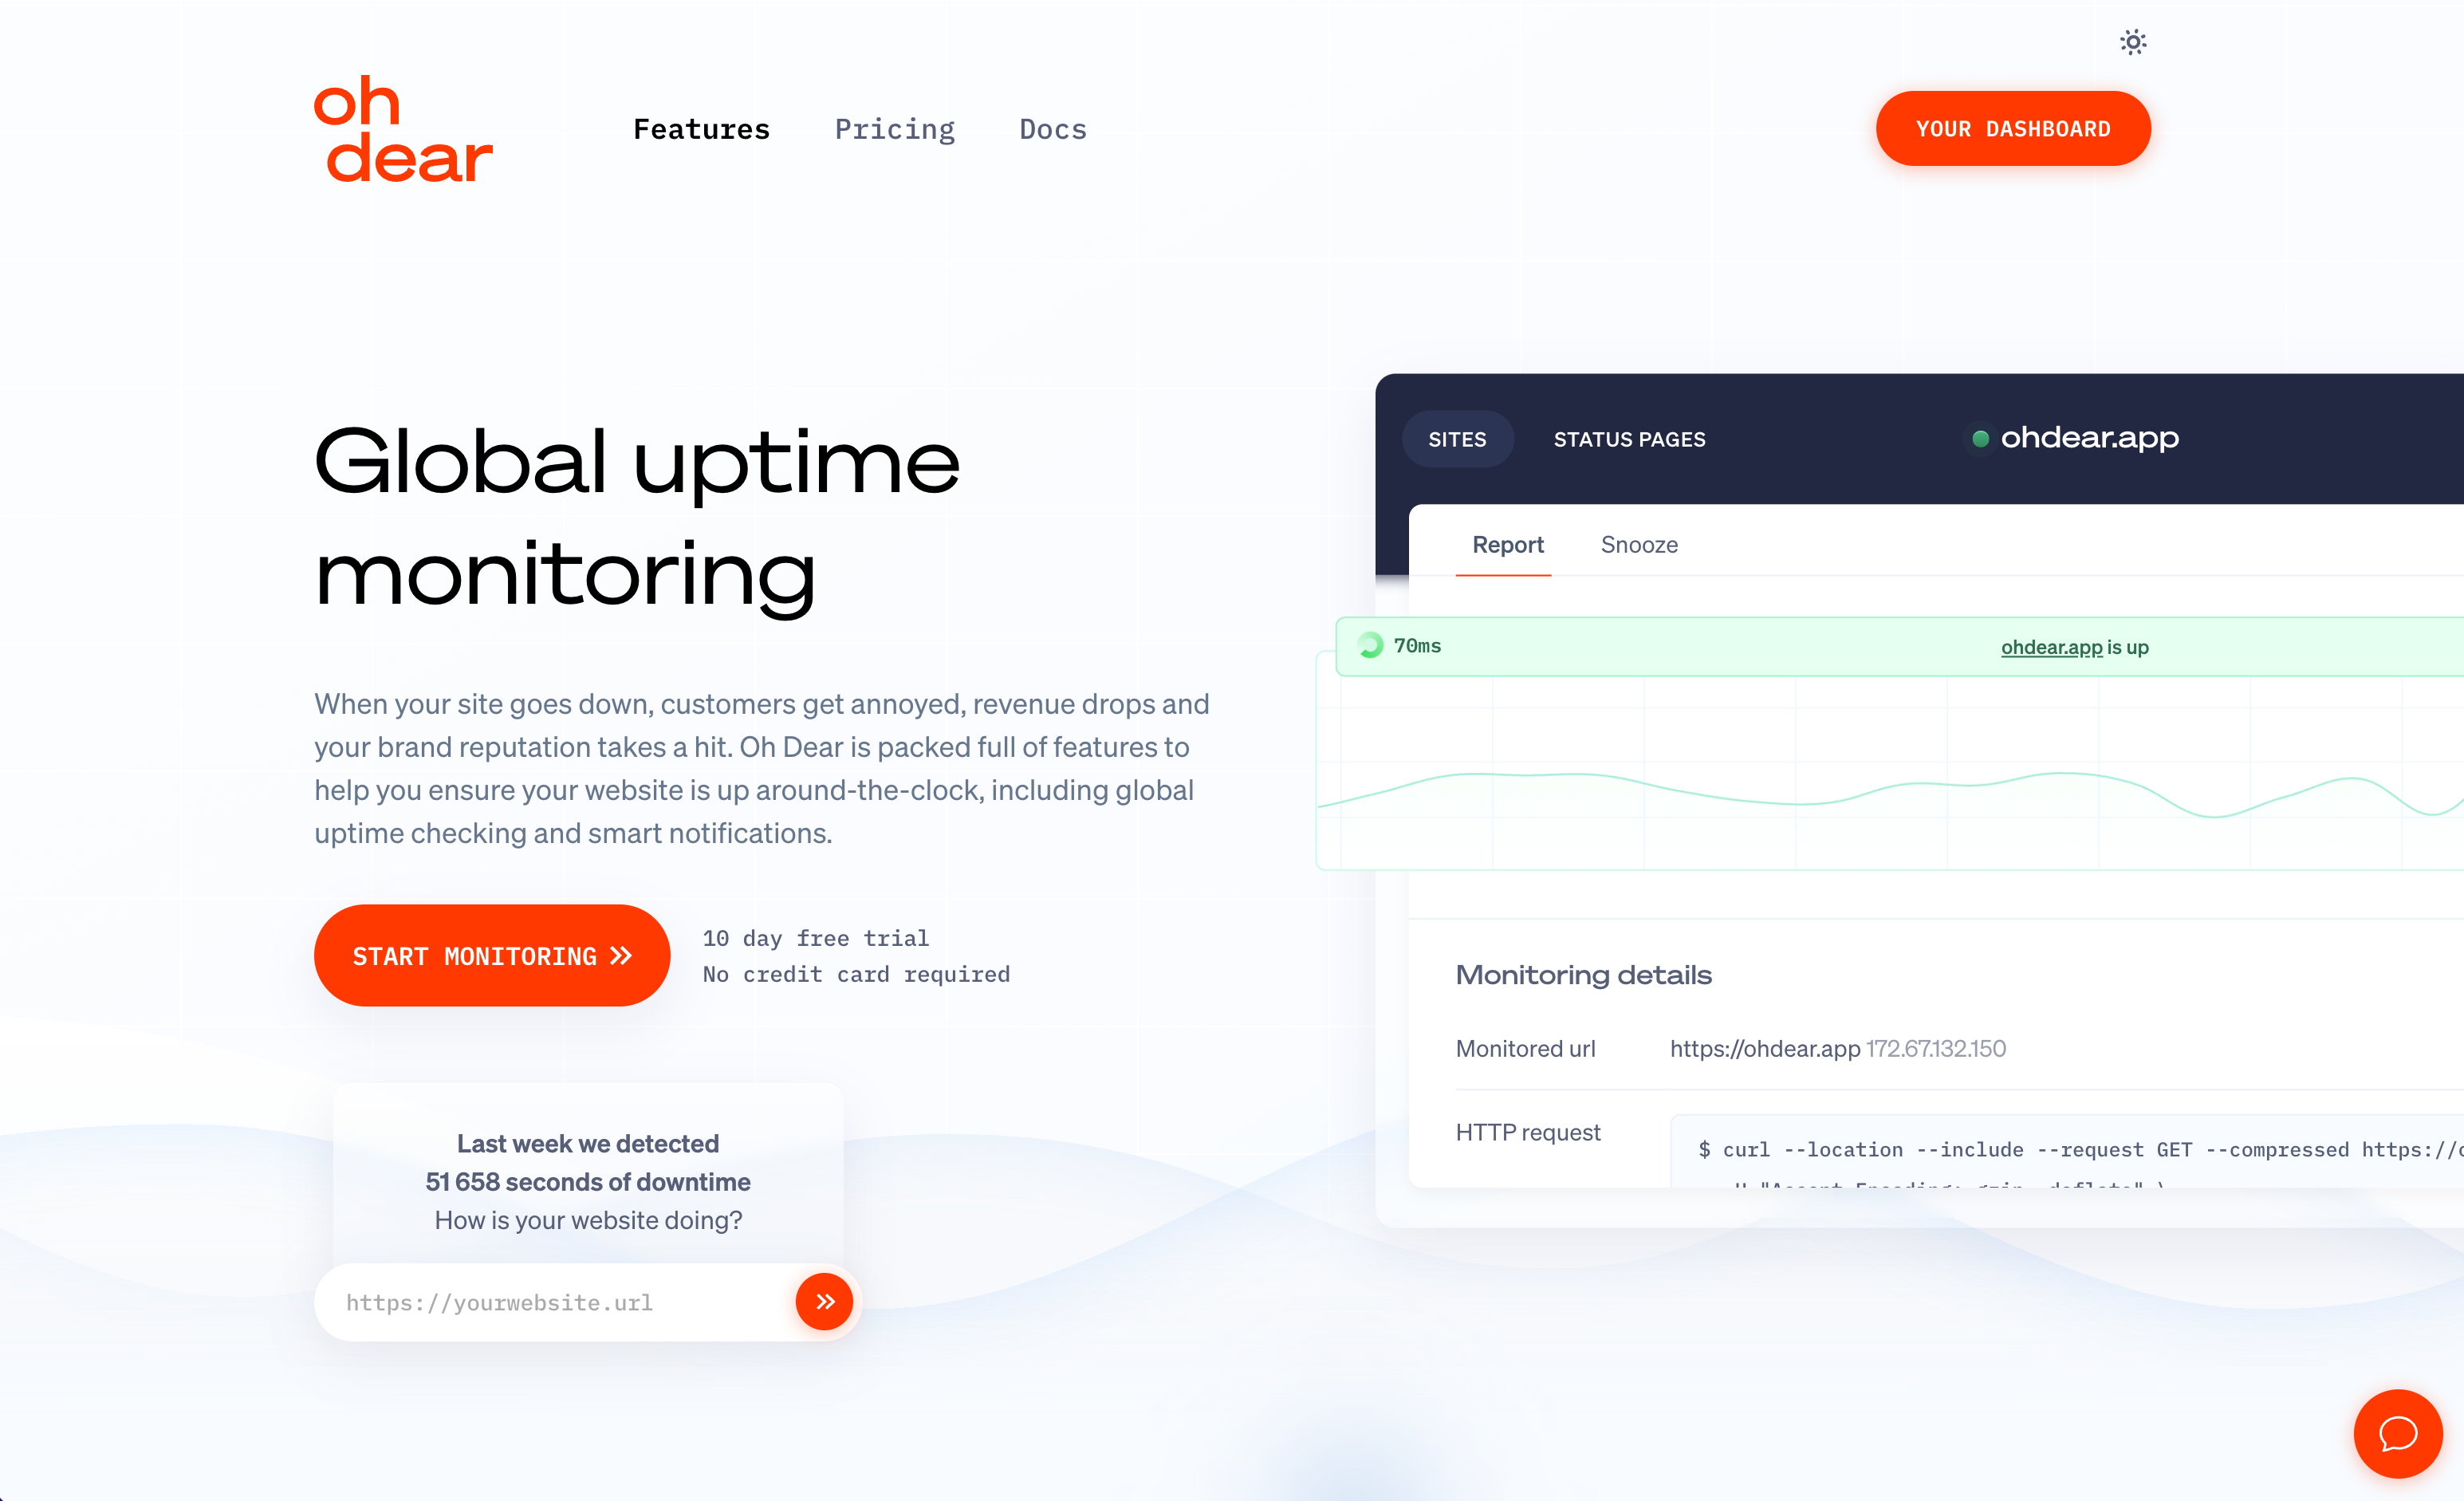
Uptime monitoring feature page#
Here’s how we highlight a particular feature, in the marketing pages. For example, our uptime checks .
Old uptime monitoring page:
New uptime monitoring page:
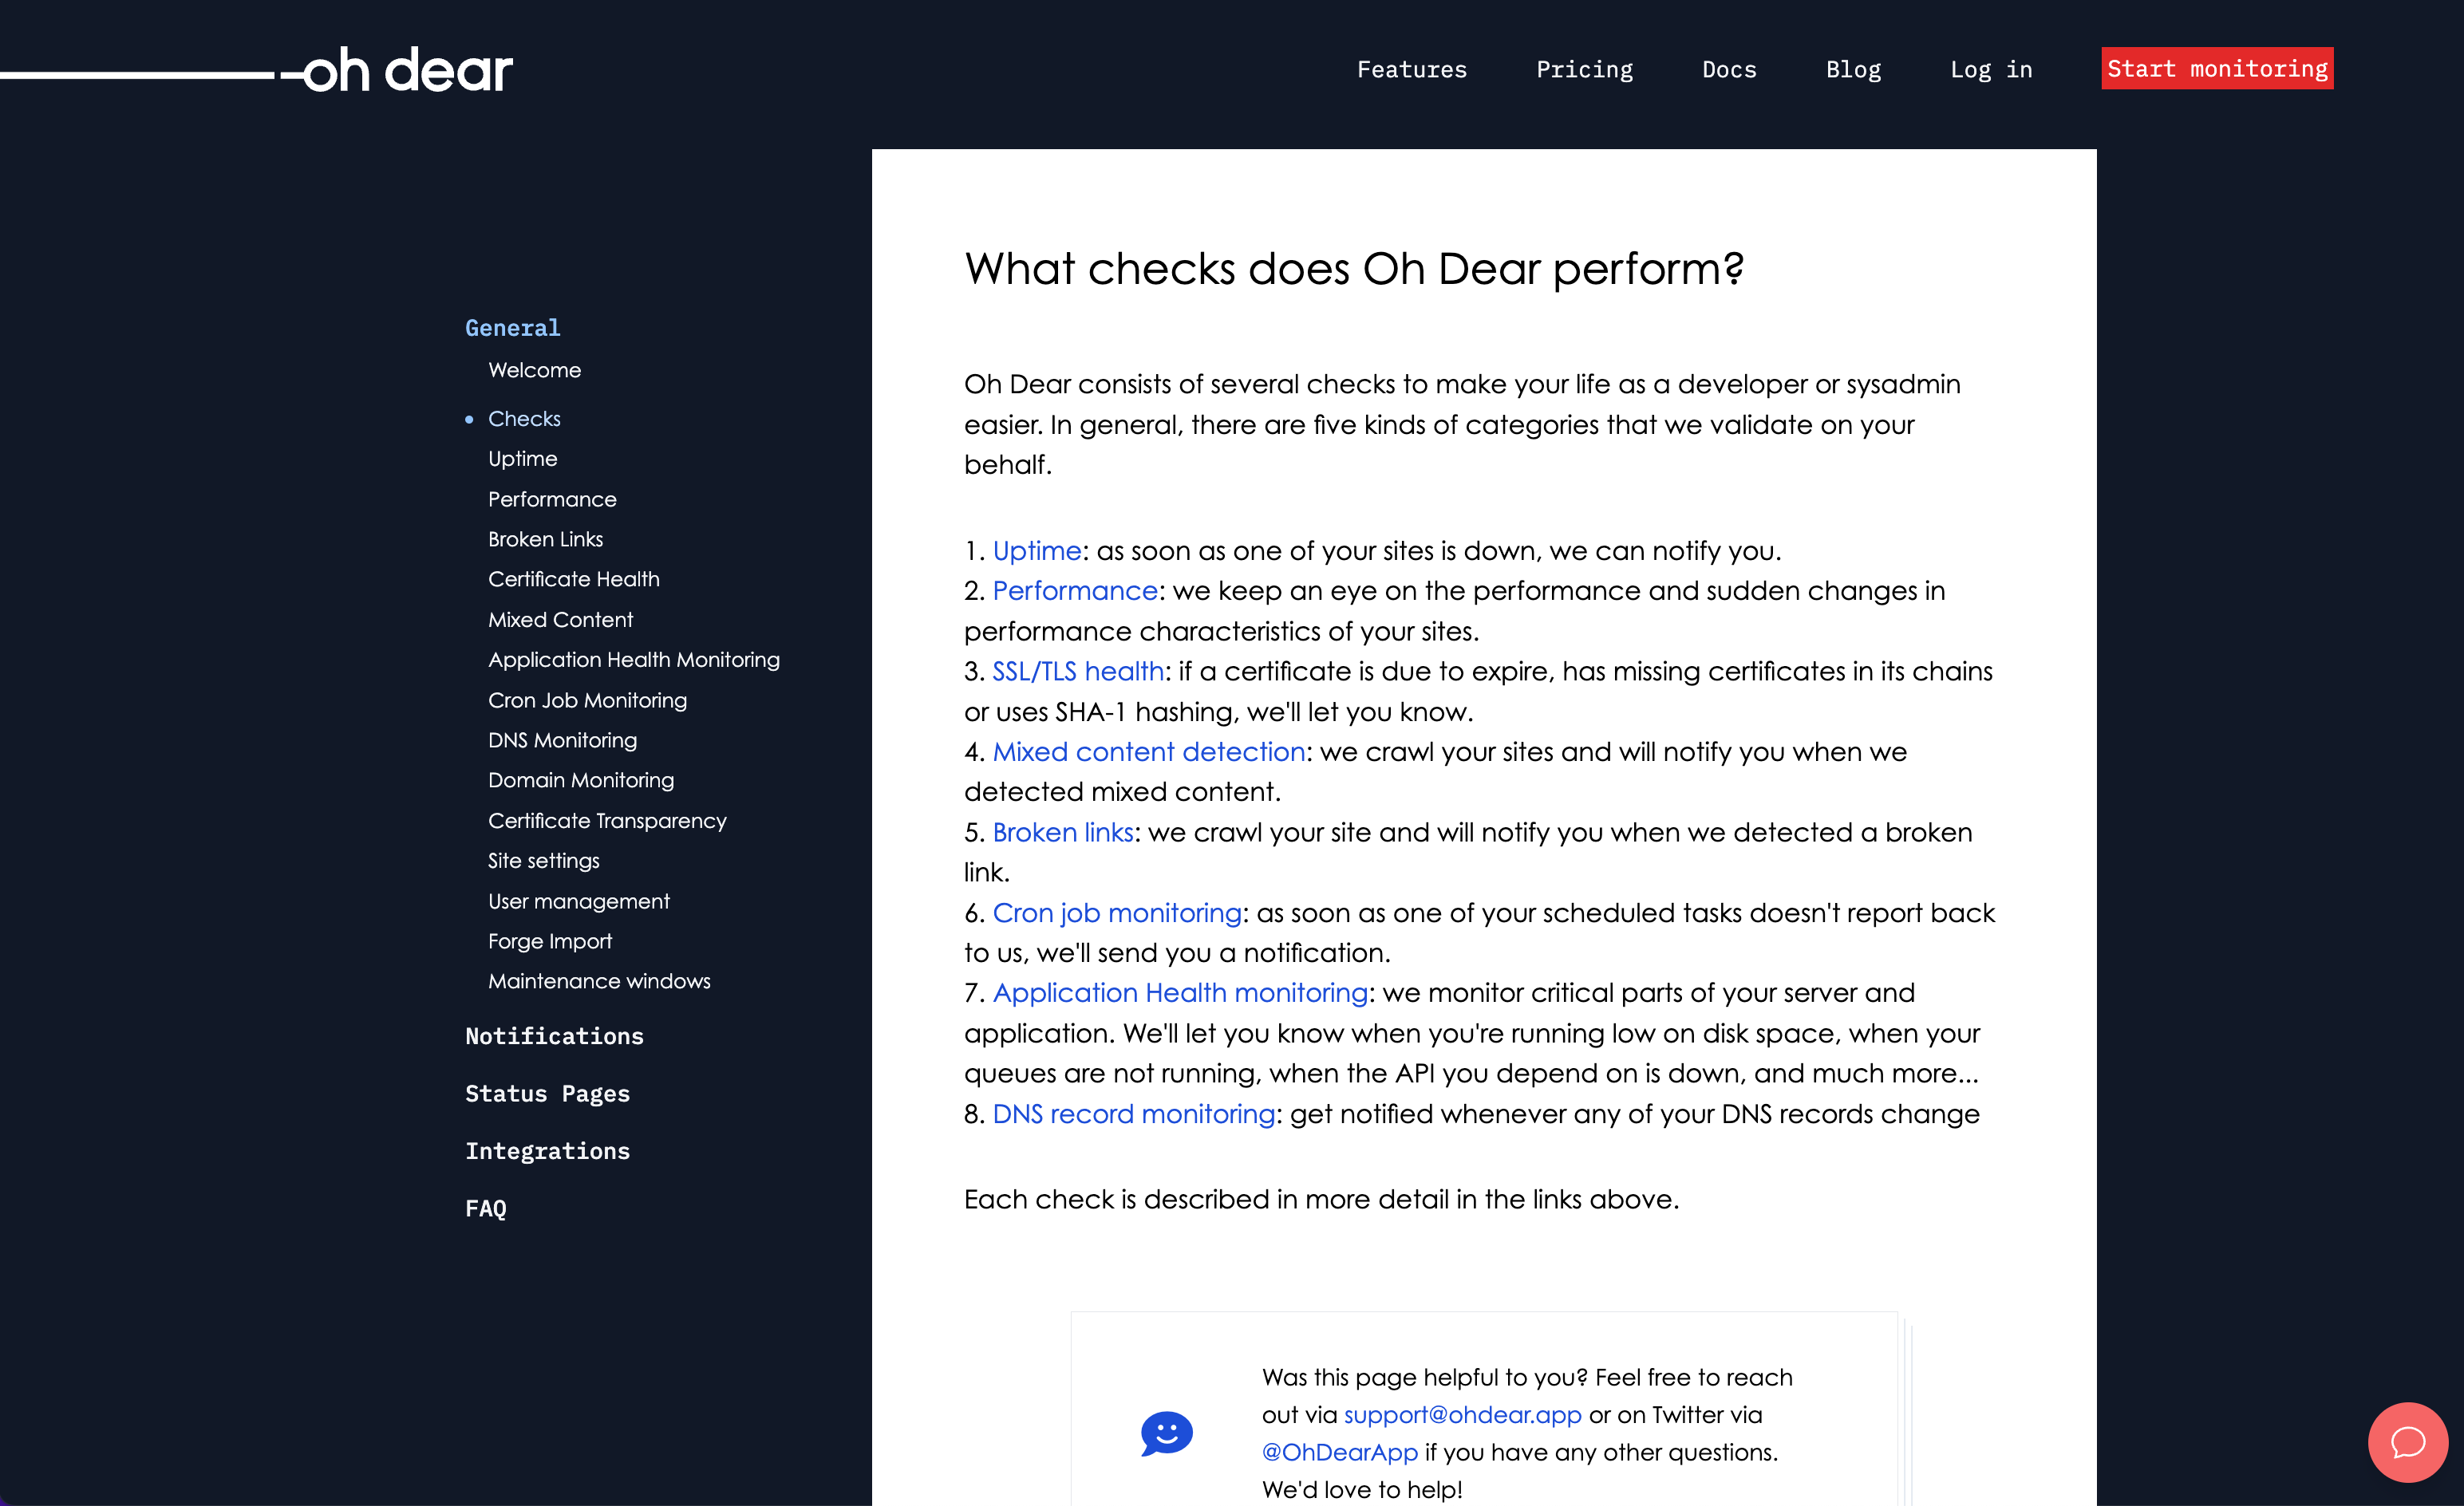
Documentation#
We’re proud to have very extensive documentation , explaining features, settings and API and integration possibilities.
Old documentation:
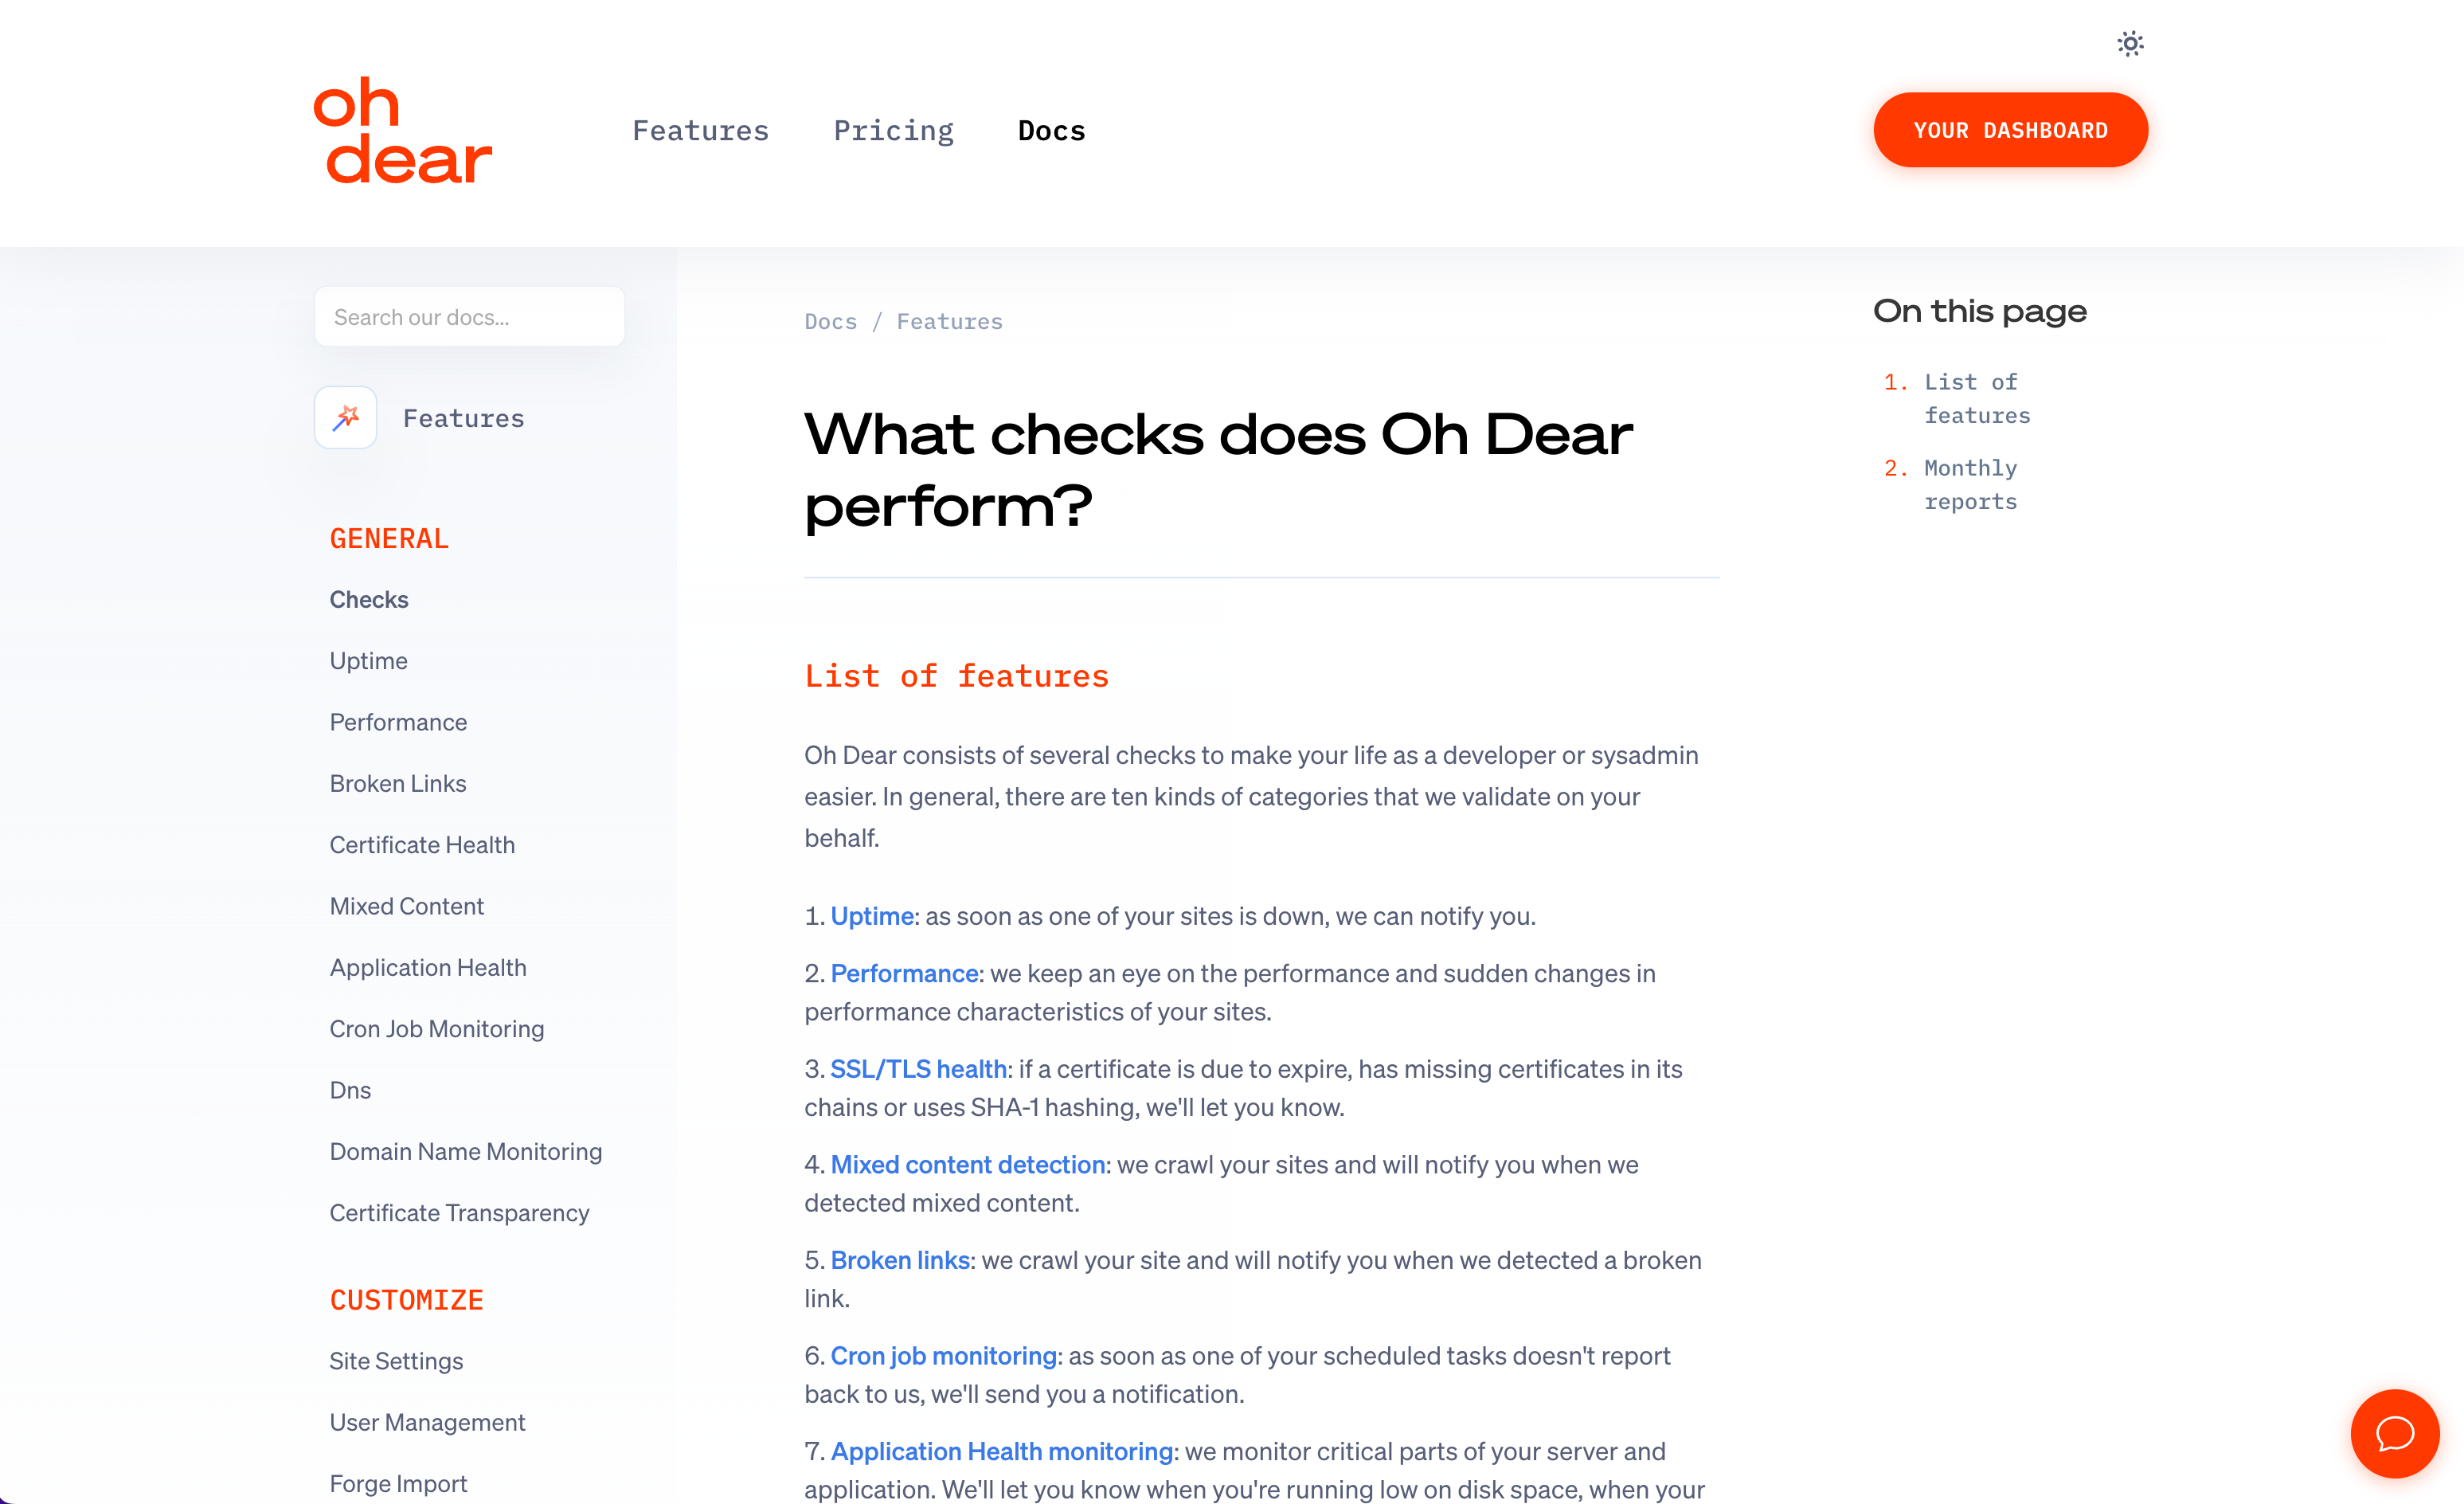
New documentation:
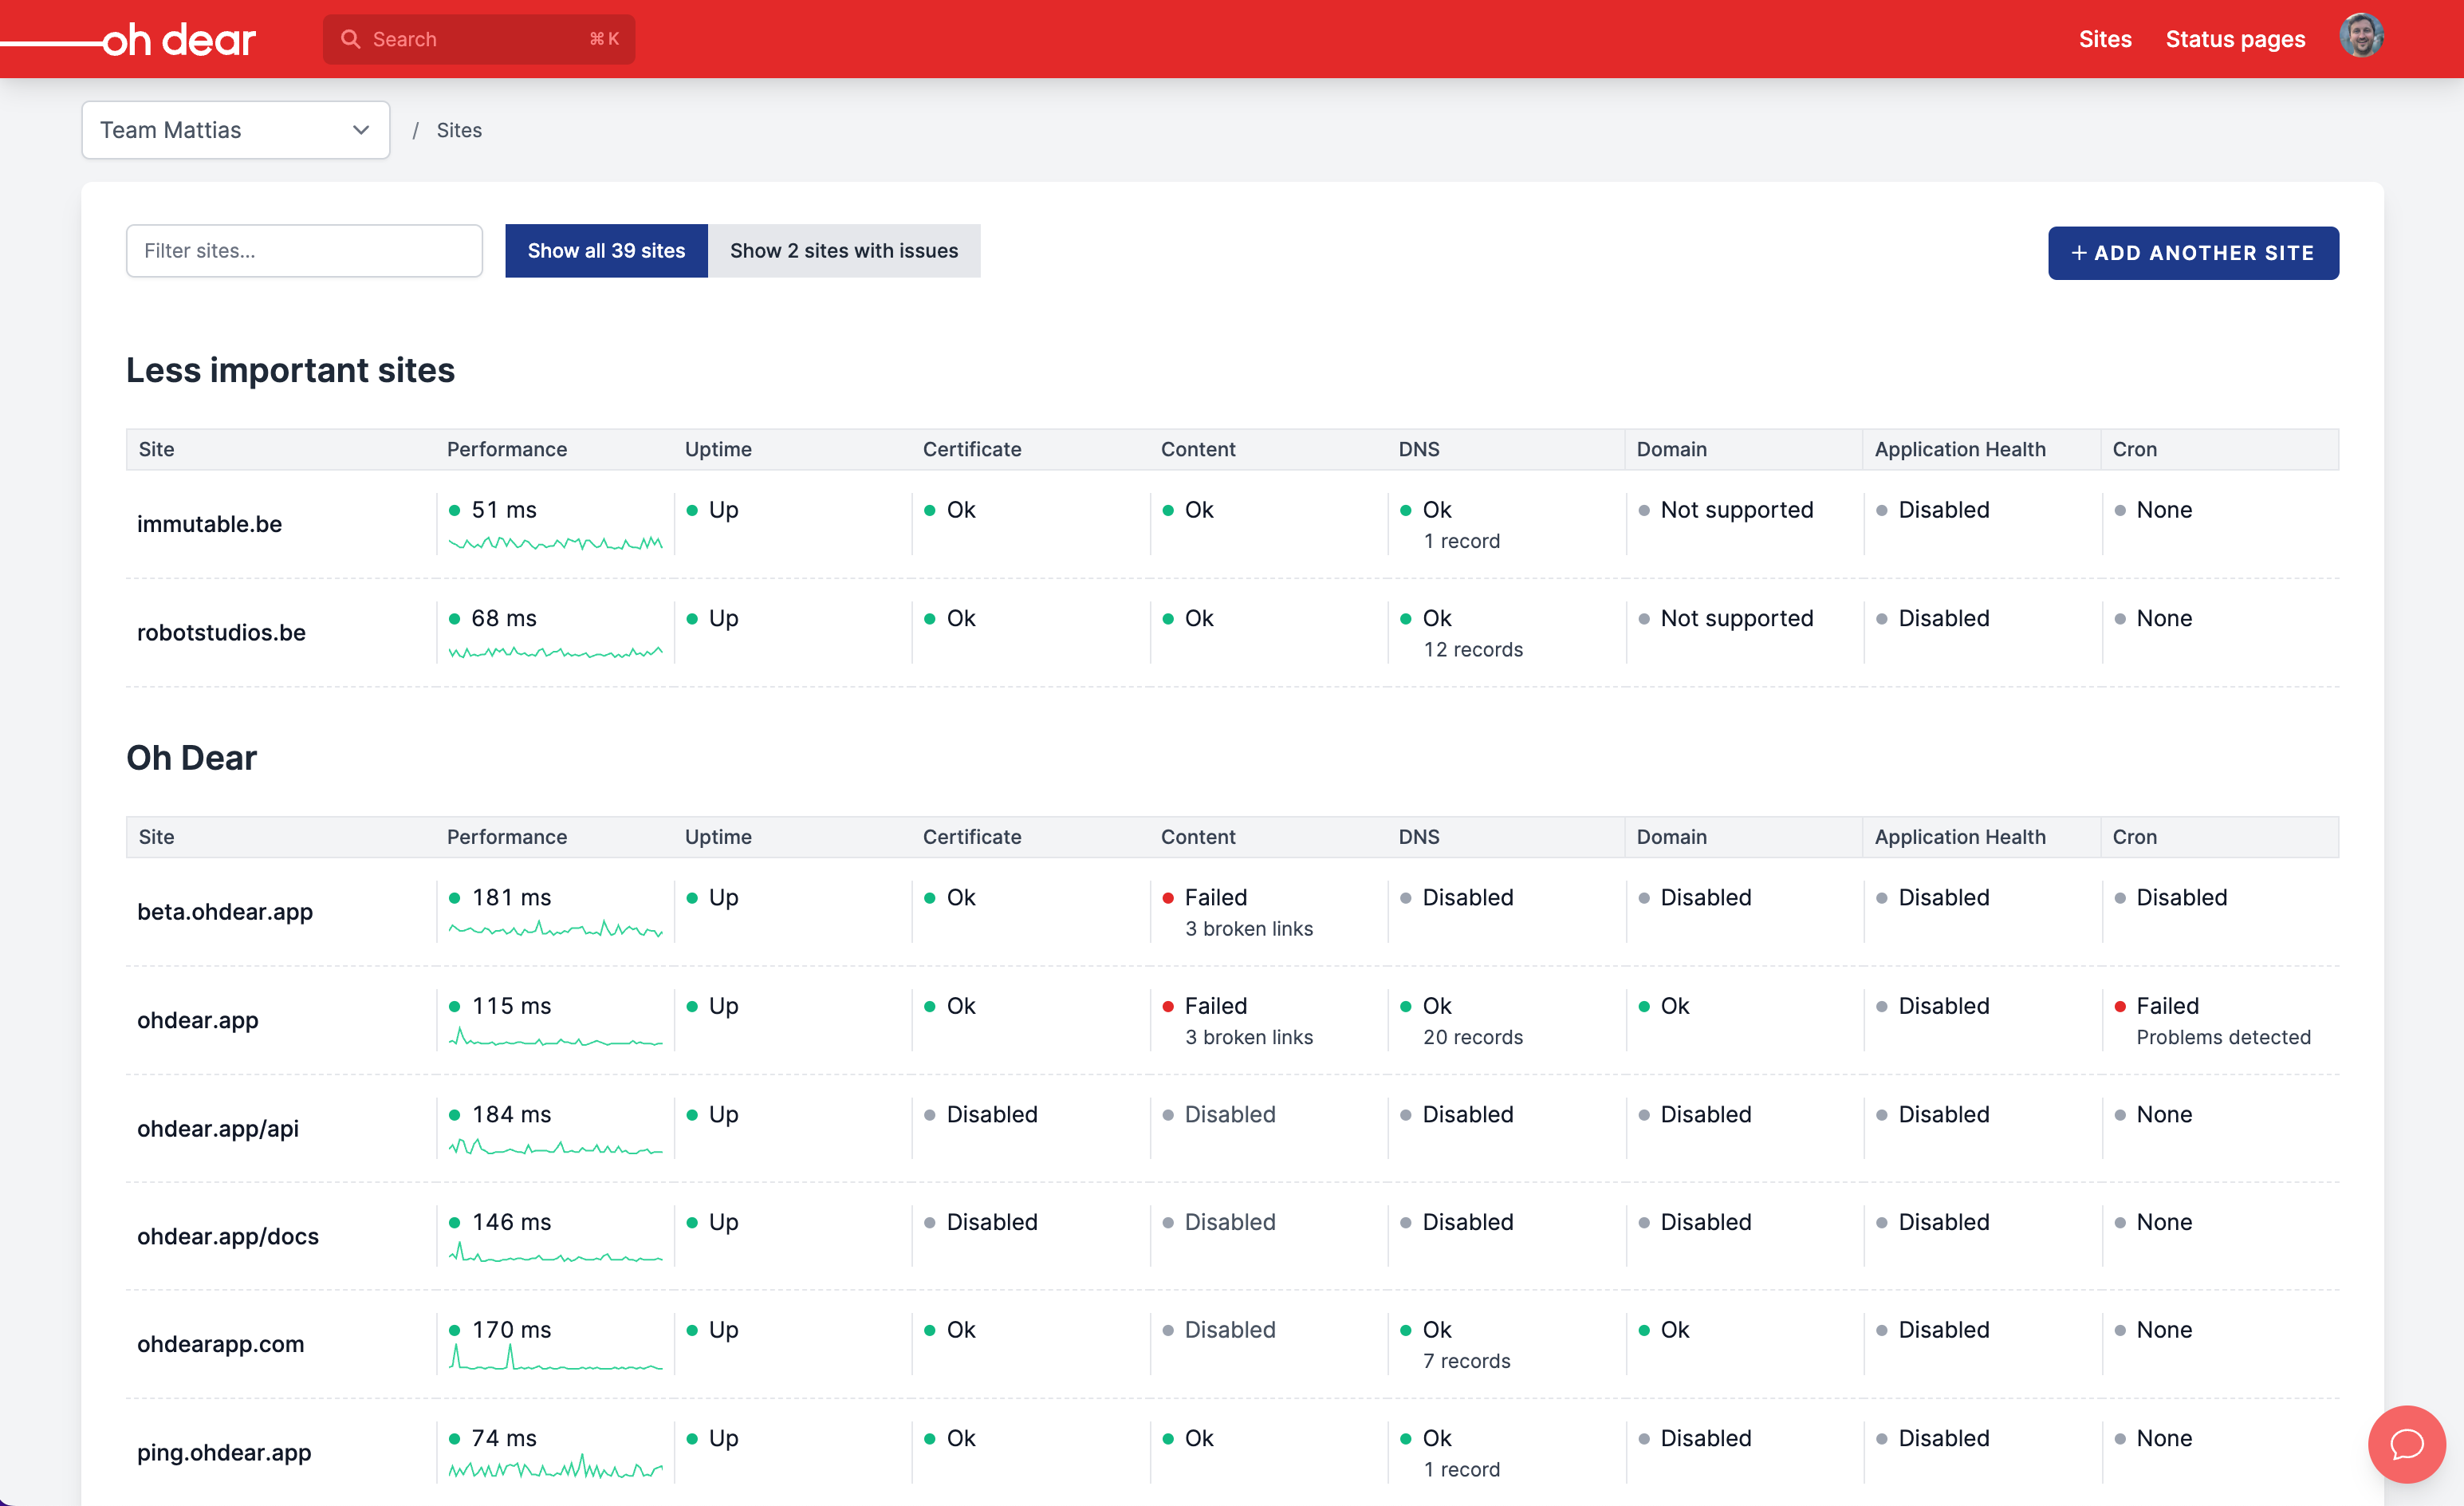
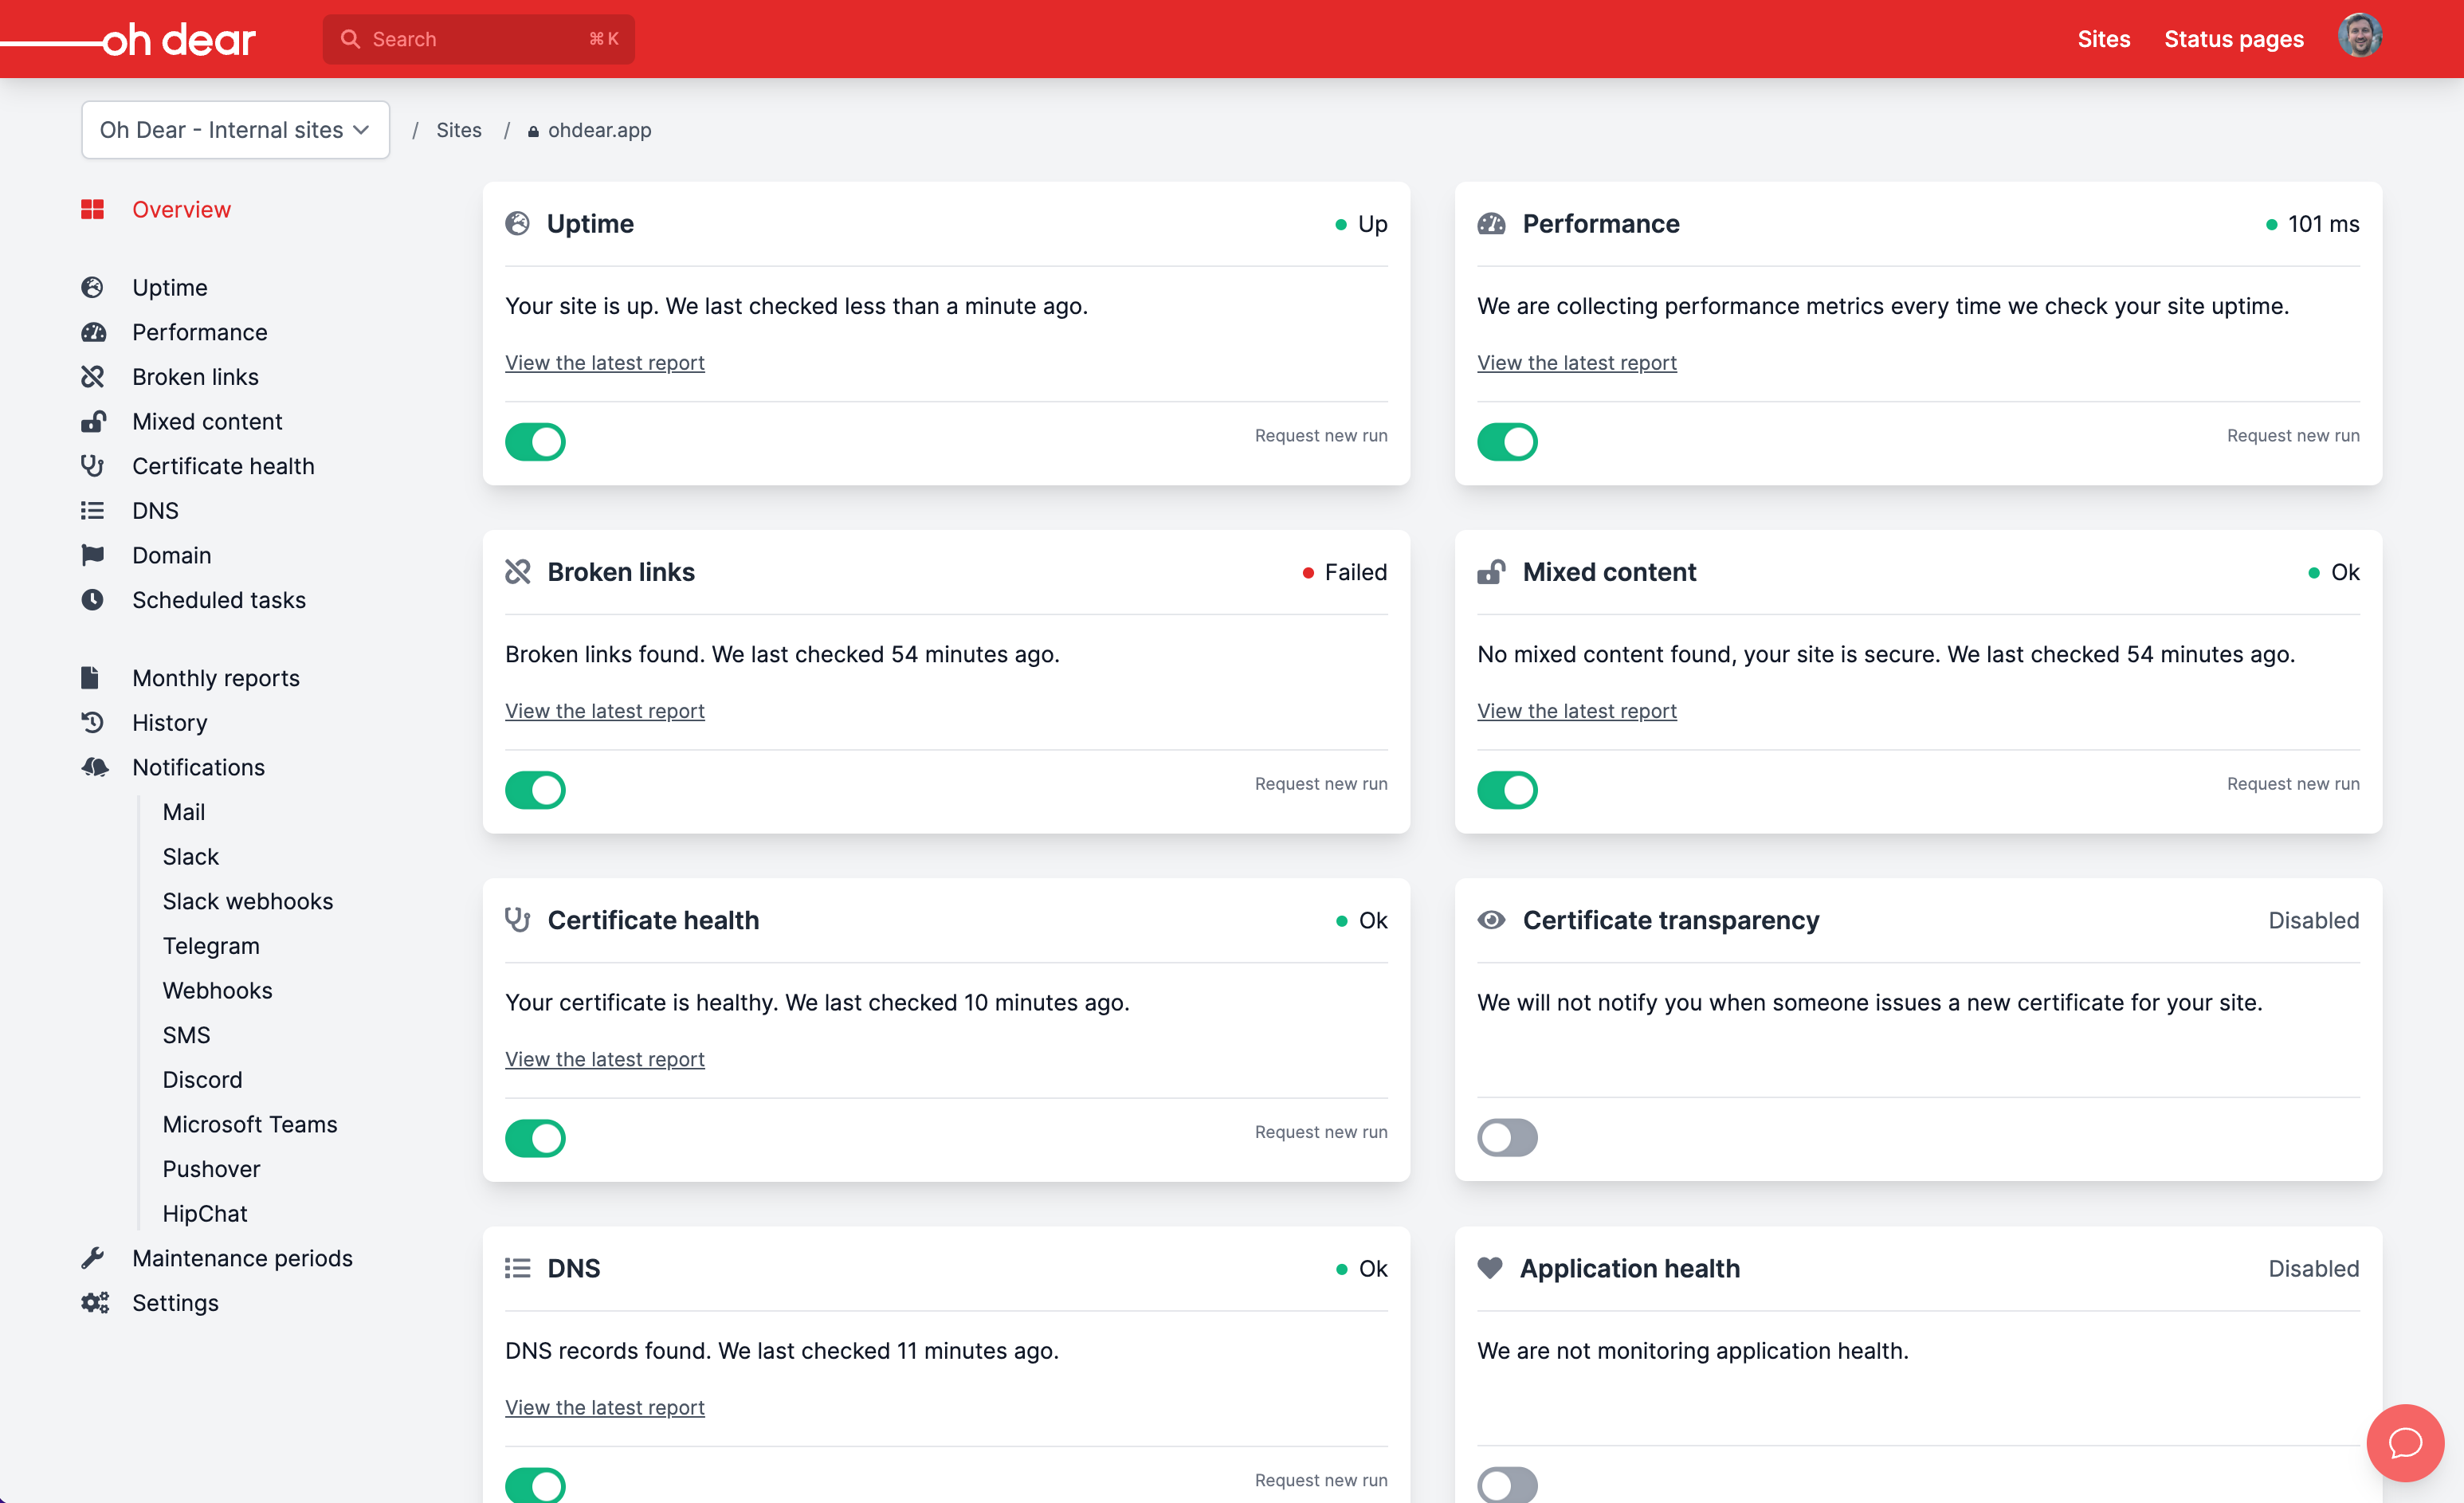
Dashboard#
This is what it looks like when you’re logged in and look at your sites that are being monitored.
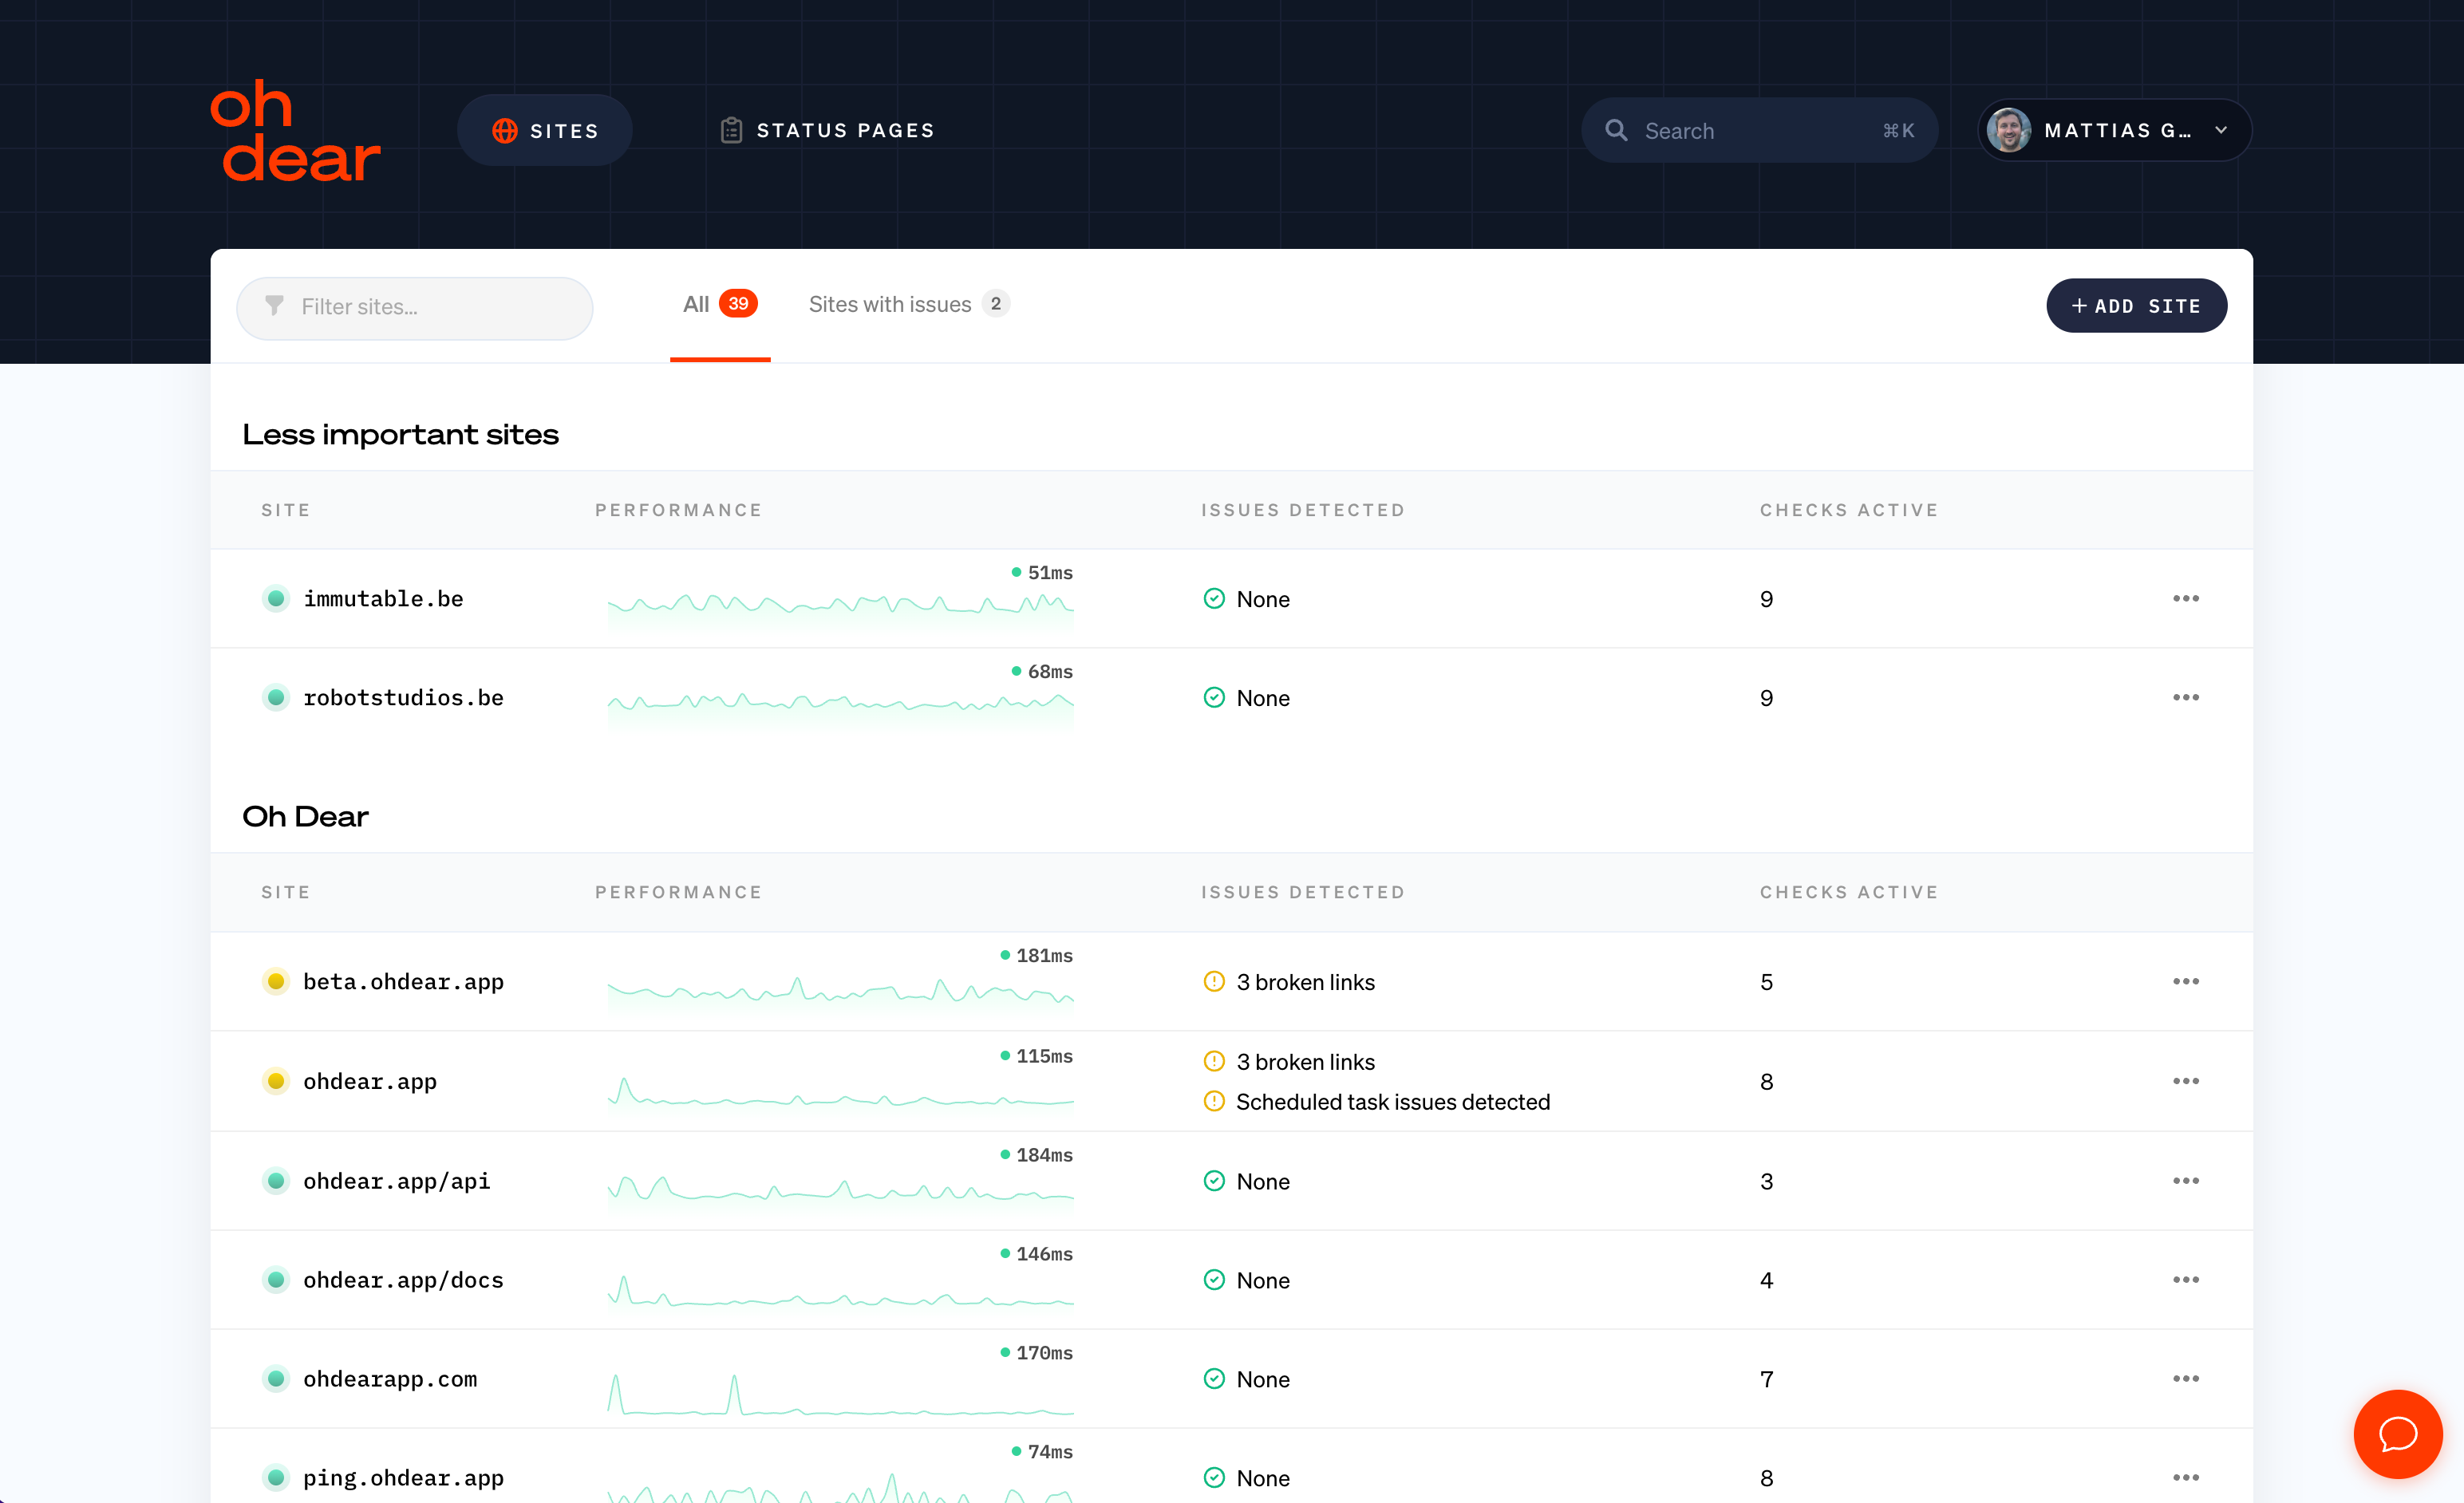
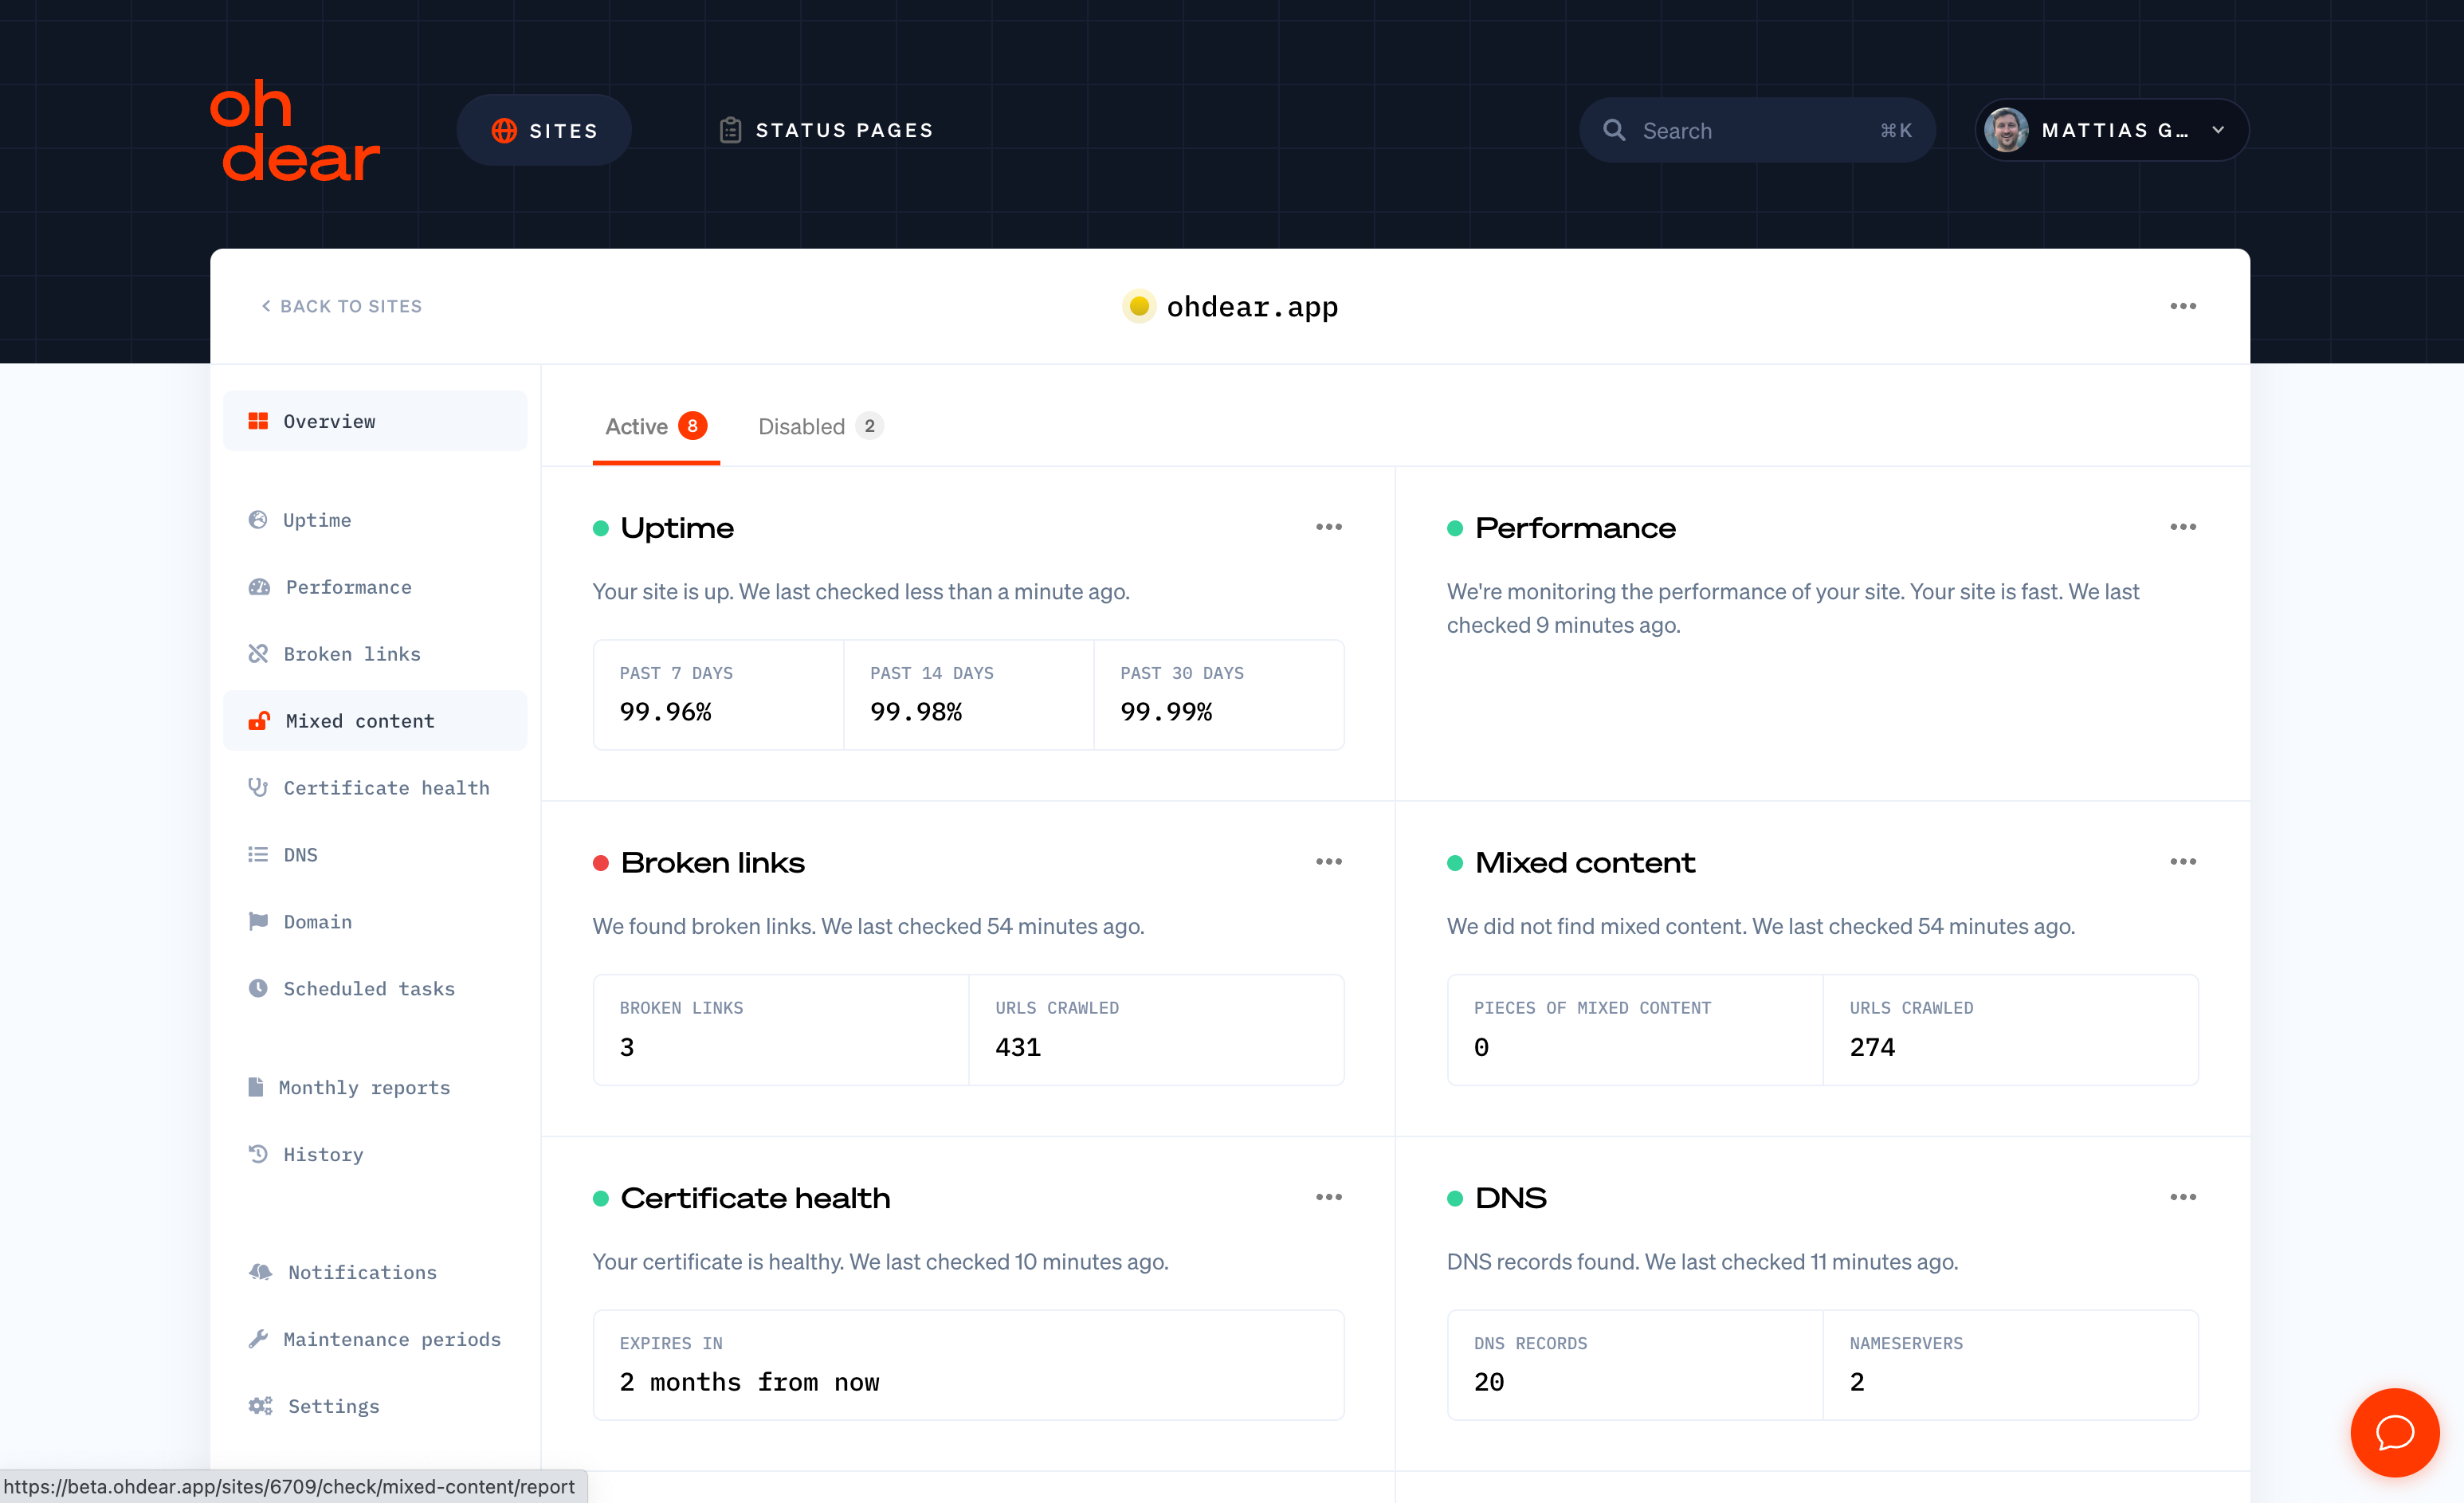
With over 10+ different checks being performed , the old layout was getting a bit cluttered. We now group the errors/alerts into a single column, to create a calmer-looking dashboard.
Old dashboard:
New dashboard:
Website overview#
This is what it looks like on a detail page of a site being monitored, offering a birds-eye-view of the state and health of the site.
Old website overview:
New website overview:
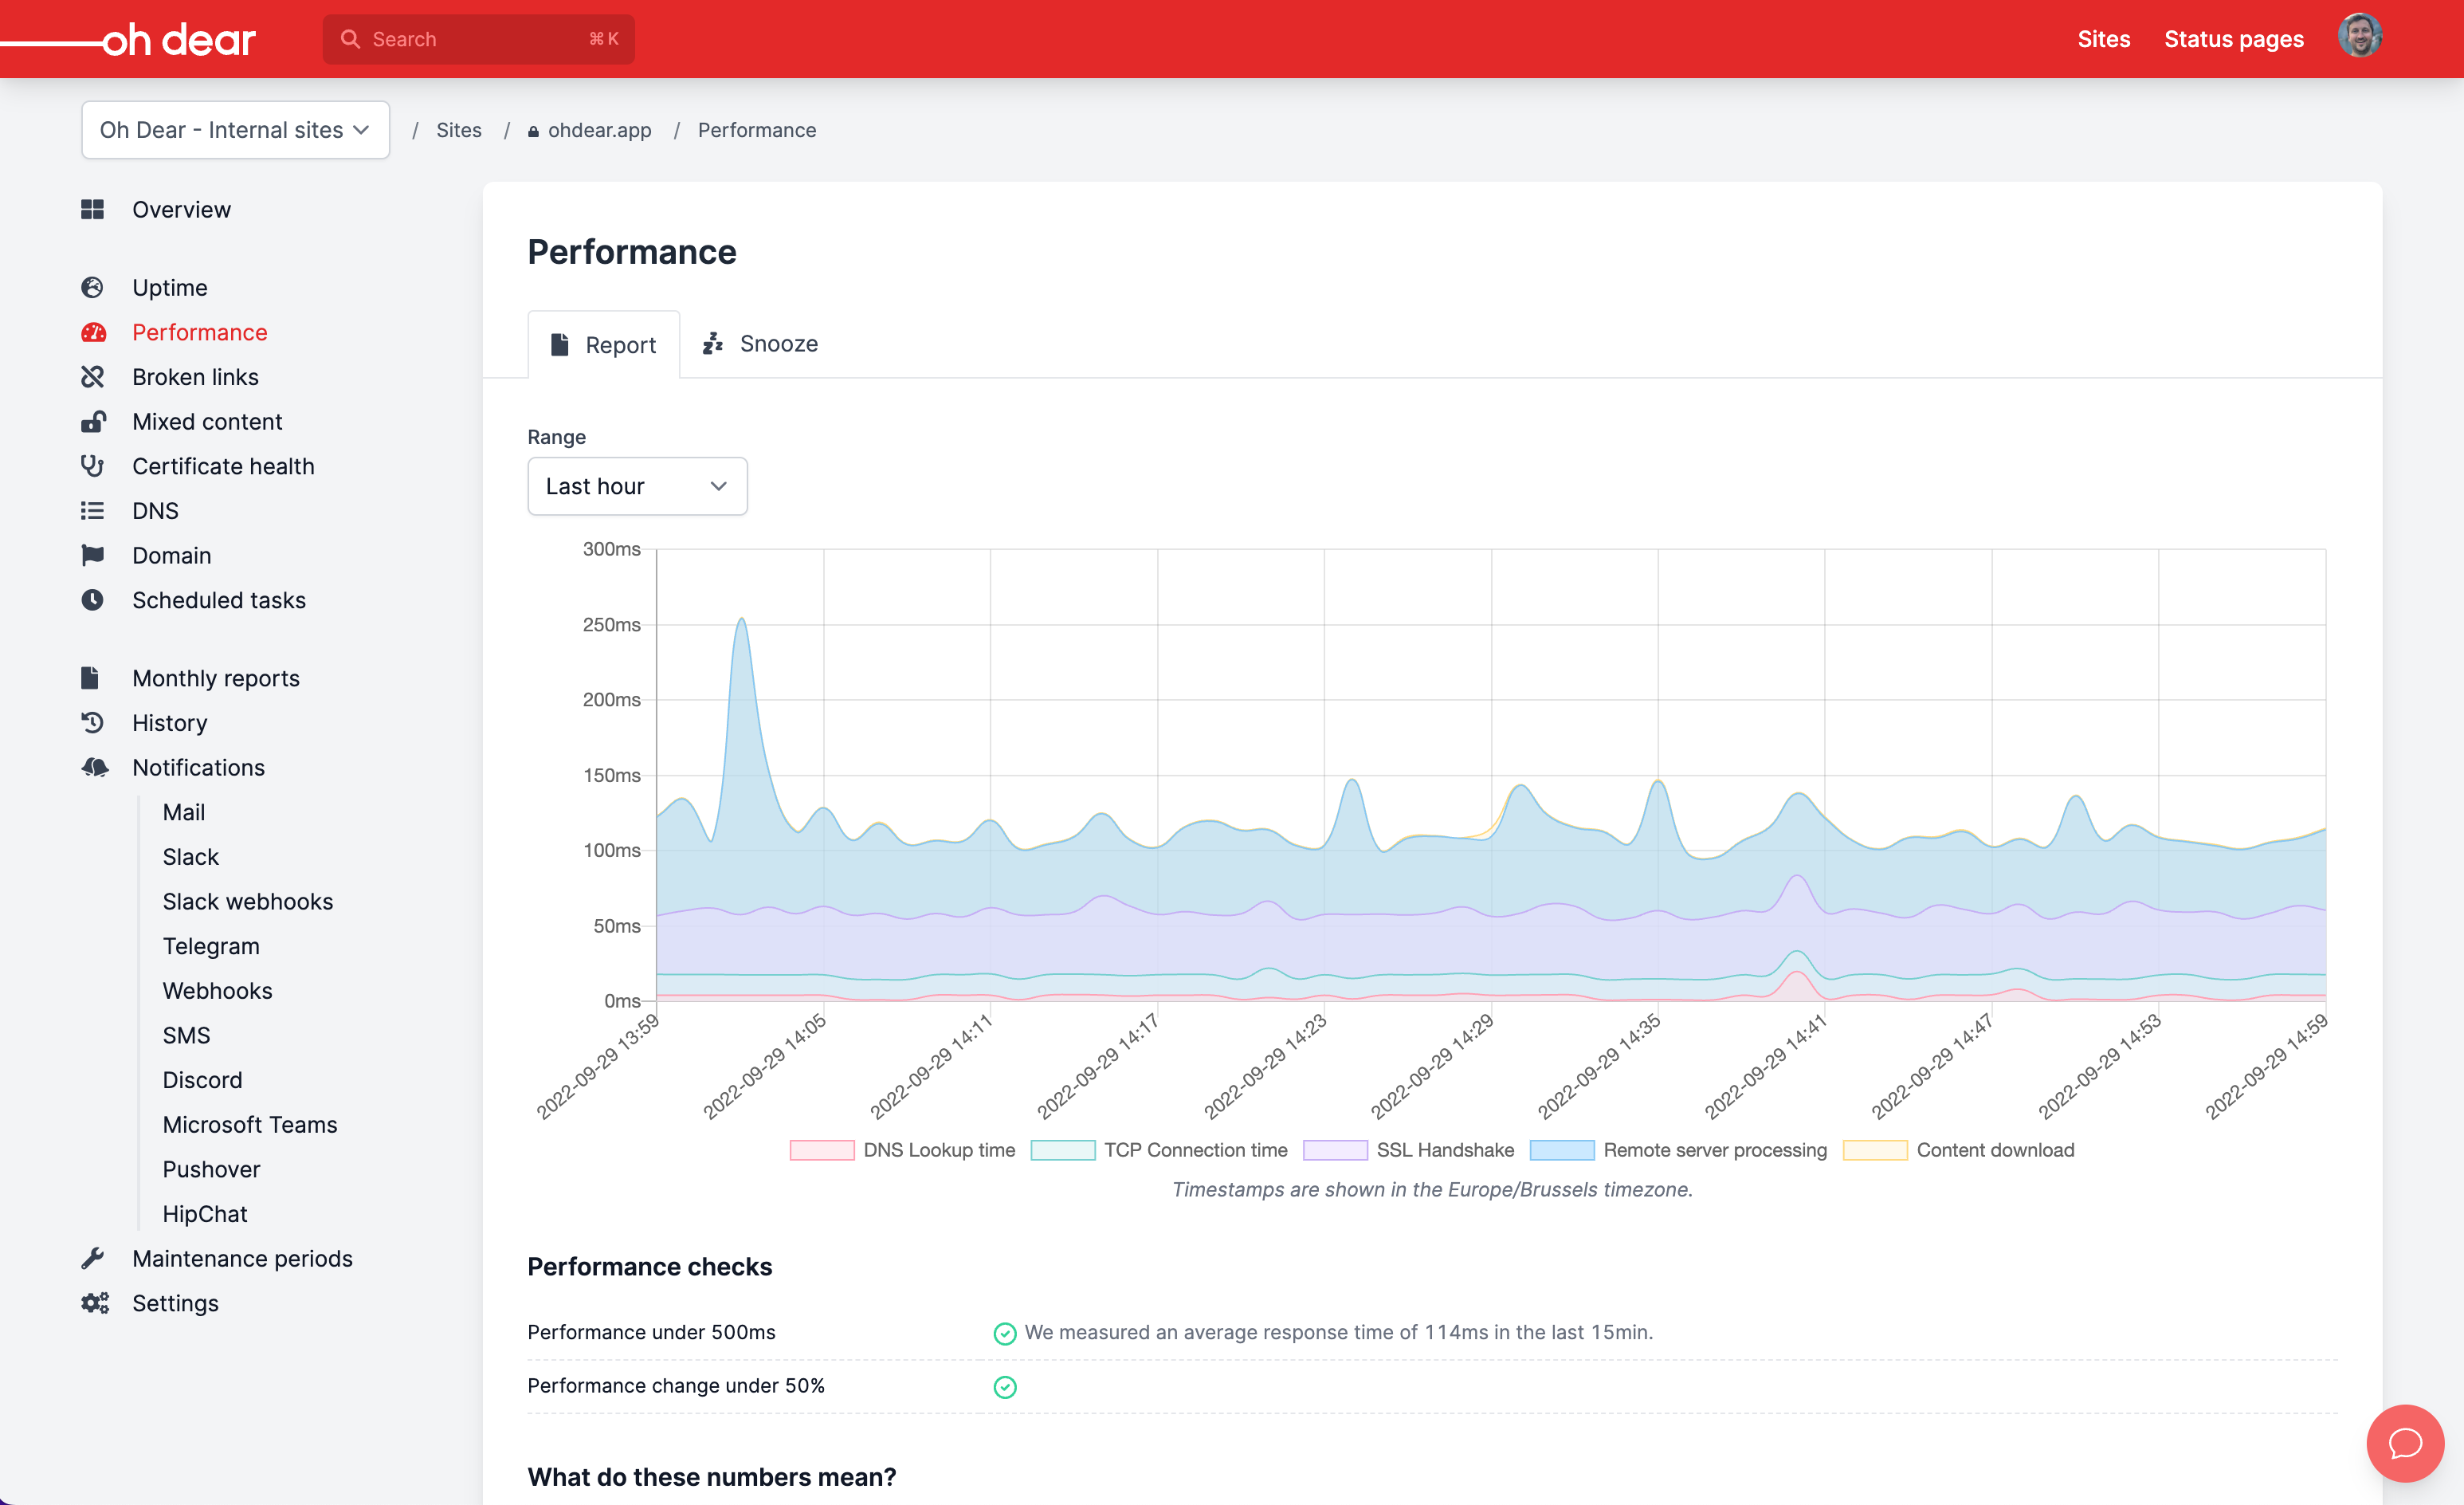
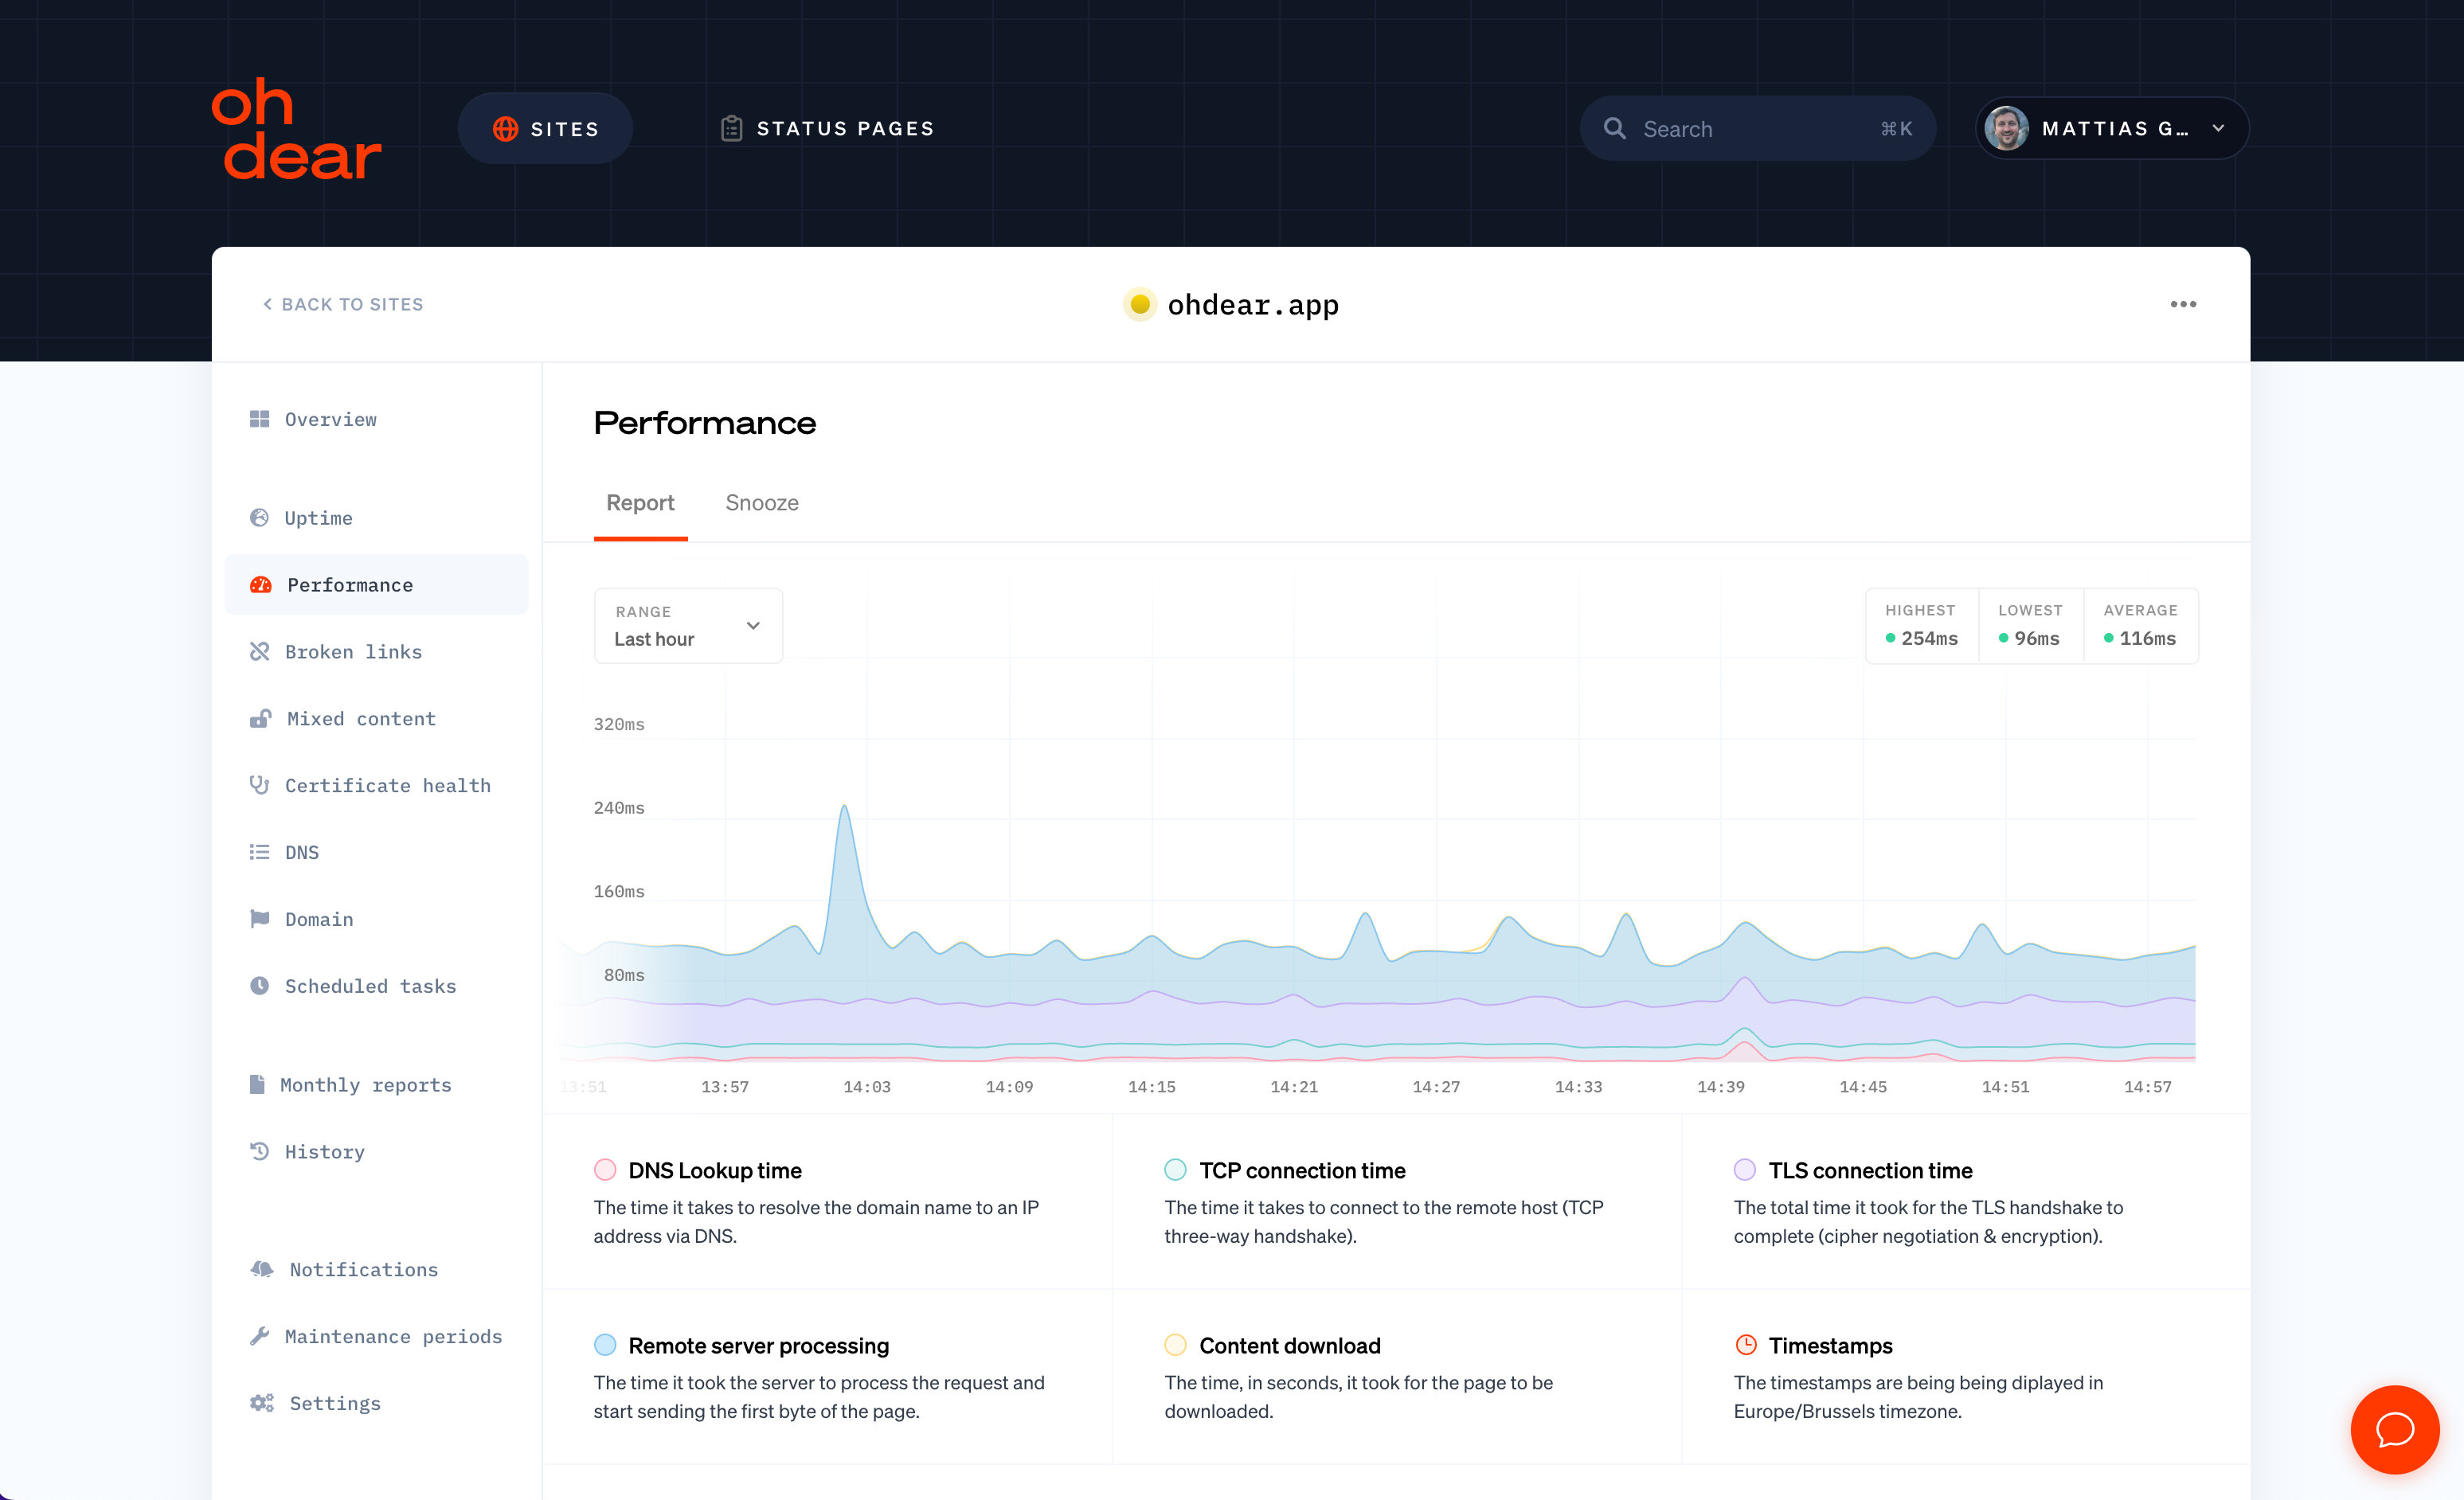
Performance pages#
First impressions matter, and I think we’ve made some good leaps forward here.
Old performance page:
New performance page:
Want to give it a try? There’s a no-card-required free trial of 10 days . Seriously, no strings attached. Try it, subscribe if you love it, ignore the emails if you hate it.
Next up on our list is:
- Mobile/responsive version of our app, so it’s as usable on mobile as it is on the desktop
- Adding additional checks & services: any tips or feedback on this is much appreciated - what’s missing today?
- Scale the service to support the next 14B checks 💪
See you guys at Oh Dear 3.0! 🥳