Paul Irish just announced this on Twitter and it’s a seriously cool feature in the Chrome Devtools! The timings tab can interpret HTTP headers sent by the application and render them.
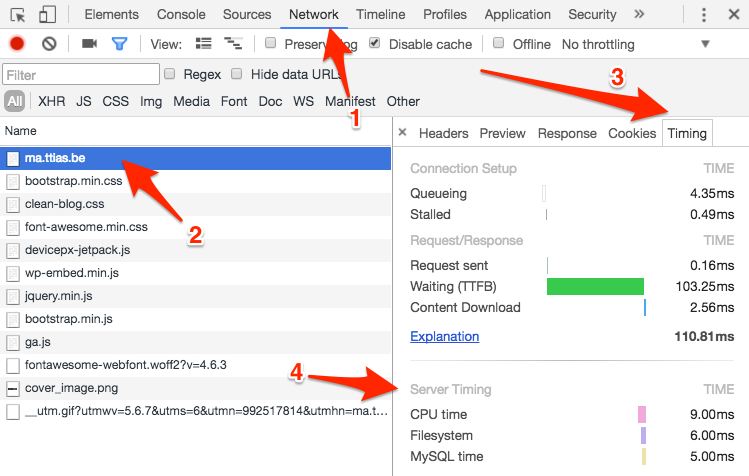
It looks like this in the Network Inspector of Chrome:

To test this, right click on this page, go to Inspect, then the** **Network tab, refresh the page, click the main resource that loaded and hit the Timings tab.

The magic is in the Server Timings block below. The browser interprets the special Server-Timing header and renders that in the timeline.
You can test this on this site as I quickly cheated with some .htaccess magic:
$ cat .htaccess
Header add Server-Timing 'cpu=0.009; "CPU", mysql=0.005; "MySQL", filesystem=0.006; "Filesystem"'
The format is very simple the Server-Timing header can contain a key=value pattern with an additional description. The time is written as seconds, so the example above is translated as;
cpu=0.009; "CPU time" ==> 9ms spent on CPU
mysql=0.005; "MySQL time" ==> 5ms spent on MySQL queries
filesystem=0.006; "Filesystem" ==> 6ms spent on the filesystem
Obviously, these are just arbitrary fixed values, but this opens a lot of opportunities for either the application or the webserver to include optional debug headers that can be used inside the browser to see how server time was spent.
If you want to include this in your own application, it’s just a matter of setting the correct Server-Timing header with the correct format, Chrome interprets the rest.
Such a cool feature!