Yet another fine piece of open source software coming from Netflix (like CPU Flame Graphs ).
Vector is an open source host-level performance monitoring framework, which exposes hand-picked, high-resolution system and application metrics to every engineer’s browser.
[…]
Previously, we’d login to instances as needed, run a variety of commands, and sift through the output for the metrics that matter. Vector cuts down the time to get to those metrics, helping us respond to incidents more quickly.
Let’s take it for a spin!
Running the web frontend#
A few caveats before you can run it: Vector requires Bower to install dependencies and optionally Gulp for running the tasks; 2 tools mostly found on developer machines, not on the server. However, if you package it in your own RPM/DEB, that shouldn’t be an issue anymore.
To avoid the installation on the server, you would run Vector on your local machine, and have it remotely connect to a PCP endpoint. More on that later.
If you’re running on a Fedora based system (Fedora, Red Hat, CentOS, …), use the following commands.
$ yum install nodejs npm
$ npm install -g bower
$ npm install -g gulp
If you’re running it on your Mac OSX, make sure you have Brew (a package manager) installed and run the following commands.
$ brew install npm
$ npm install -g bower
$ npm install -g gulp
Now that you’ve got the preparations all done, download & run the Vector tool.
$ git clone https://github.com/Netflix/vector.git
$ cd vector/
$ bower install
$ cd app/
$ python -m SimpleHTTPServer 8080
The last command starts a simple Python HTTP server on port 8080. Browse to http://localhost:8080/ to start the app.
Running Performance Co-Pilot (PCP)#
Vector uses the PCP framework for collecting host metrics, so that service needs to be running.
$ yum install pcp pcp-webapi
$ service pcp start
$ service pmwebd start
Afterwards, the Vector tool will connect directly to the pcp-webapi port (:44323), so make sure it’s firewalled! There’s no authentication needed by default (but it’s available, if you want it ).
$ netstat -anp | grep ':44323'
tcp        0      0 0.0.0.0:44323     0.0.0.0:*   LISTEN      8970/pmwebd
tcp        0      0 :::44323          :::*        LISTEN      8970/pmwebd
In this regard, running Vector with PCP is similar to running Kibana , a client-side frontend that connects directly to an Elasticsearch instance.
This modus operandi of having a client-side interface to a remote endpoint is ideal for running the Vector tool locally (on your laptop, mac, …), and having it connect to a remote PCP endpoint, that’s running on each of your hosts.
No need to run the WebUI on any server!
A downside of running PCP on RHEL/CentOS systems: the PCP version currently supplied in EPEL repo’s is 3.9.4. The version you need is … 3.10. So bummer.
That leaves you with 2 options: try the RPM packages supplied by PCP themselves
or compile from source. If you’re going to compile from source, have a look at the RPM build steps in the PCP Vagrantfile
, it has step-by-step instructions on compiling PCP from source and creating RPM/DEB files via ./Makepkgs.
It also requires a truckload of devel-dependencies, if you’re compiling from source. These should be the full steps.
$ git clone [email protected]:performancecopilot/pcp.git
$ cd pcp
$ yum -y groupinstall 'Development Tools'
$ yum -y install git ncurses-devel readline-devel man libmicrohttpd-devel qt4-devel\
  python26 python26-devel perl-JSON sysstat perl-TimeDate \
  perl-XML-TokeParser perl-ExtUtils-MakeMaker perl-Time-HiRes \
  systemd-devel bc cairo-devel cyrus-sasl-devel \
  systemd-devel libibumad-devel libibmad-devel papi-devel libpfm-devel \
  rpm-devel perl-Spreadsheet-WriteExcel perl-Text-CSV_XS bind-utils httpd \
  python-devel nspr-devel nss-devel python-ctypes nss-tools \
  perl-Spreadsheet-XLSX ed cpan valgrind time xdpyinfo rrdtool-perl
$ env PYTHON=python2.6 ./Makepkgs
$ rpm -ivh  pcp-*/build/rpm/*.rpm
Preparing...                ########################################### [100%]
   1:pcp-conf               ########################################### [  4%]
   2:pcp-libs               ########################################### [  9%]
   3:perl-PCP-PMDA          ########################################### [ 13%]
   4:python-pcp             ########################################### [ 17%]
   5:pcp                    ########################################### [ 22%]
Rebuilding PMNS ...
Starting pmcd ...
Starting pmlogger ...
Starting pmie ...
Starting pmproxy ...
   6:perl-PCP-LogImport     ########################################### [ 26%]
   7:pcp-libs-devel         ########################################### [ 30%]
   8:pcp-testsuite          ########################################### [ 35%]
   9:pcp-import-ganglia2pcp ########################################### [ 39%]
  10:pcp-import-iostat2pcp  ########################################### [ 43%]
  11:pcp-import-mrtg2pcp    ########################################### [ 48%]
  12:pcp-import-sar2pcp     ########################################### [ 52%]
  13:pcp-import-sheet2pcp   ########################################### [ 57%]
  14:pcp-gui                ########################################### [ 61%]
  15:pcp-manager            ########################################### [ 65%]
Starting pmmgr ...
  16:pcp-pmda-infiniband    ########################################### [ 70%]
  17:pcp-pmda-papi          ########################################### [ 74%]
  18:perl-PCP-LogSummary    ########################################### [ 78%]
  19:perl-PCP-MMV           ########################################### [ 83%]
  20:pcp-import-collectl2pcp########################################### [ 87%]
  21:pcp-webapi             ########################################### [ 91%]
Starting pmwebd ...
  22:pcp-doc                ########################################### [ 96%]
  23:pcp-debuginfo          ########################################### [100%]
  24:pcp                    ########################################### [104%]
Once you’ve got the latest version of PCP running, the PCP web API will work.
$ service pmcd restart
$ service pmwebd restart
What’s really cool is the short interval you have for gathering statistics. Similar to statsd , but without having to determine your own keys and items first.
What it looks like#
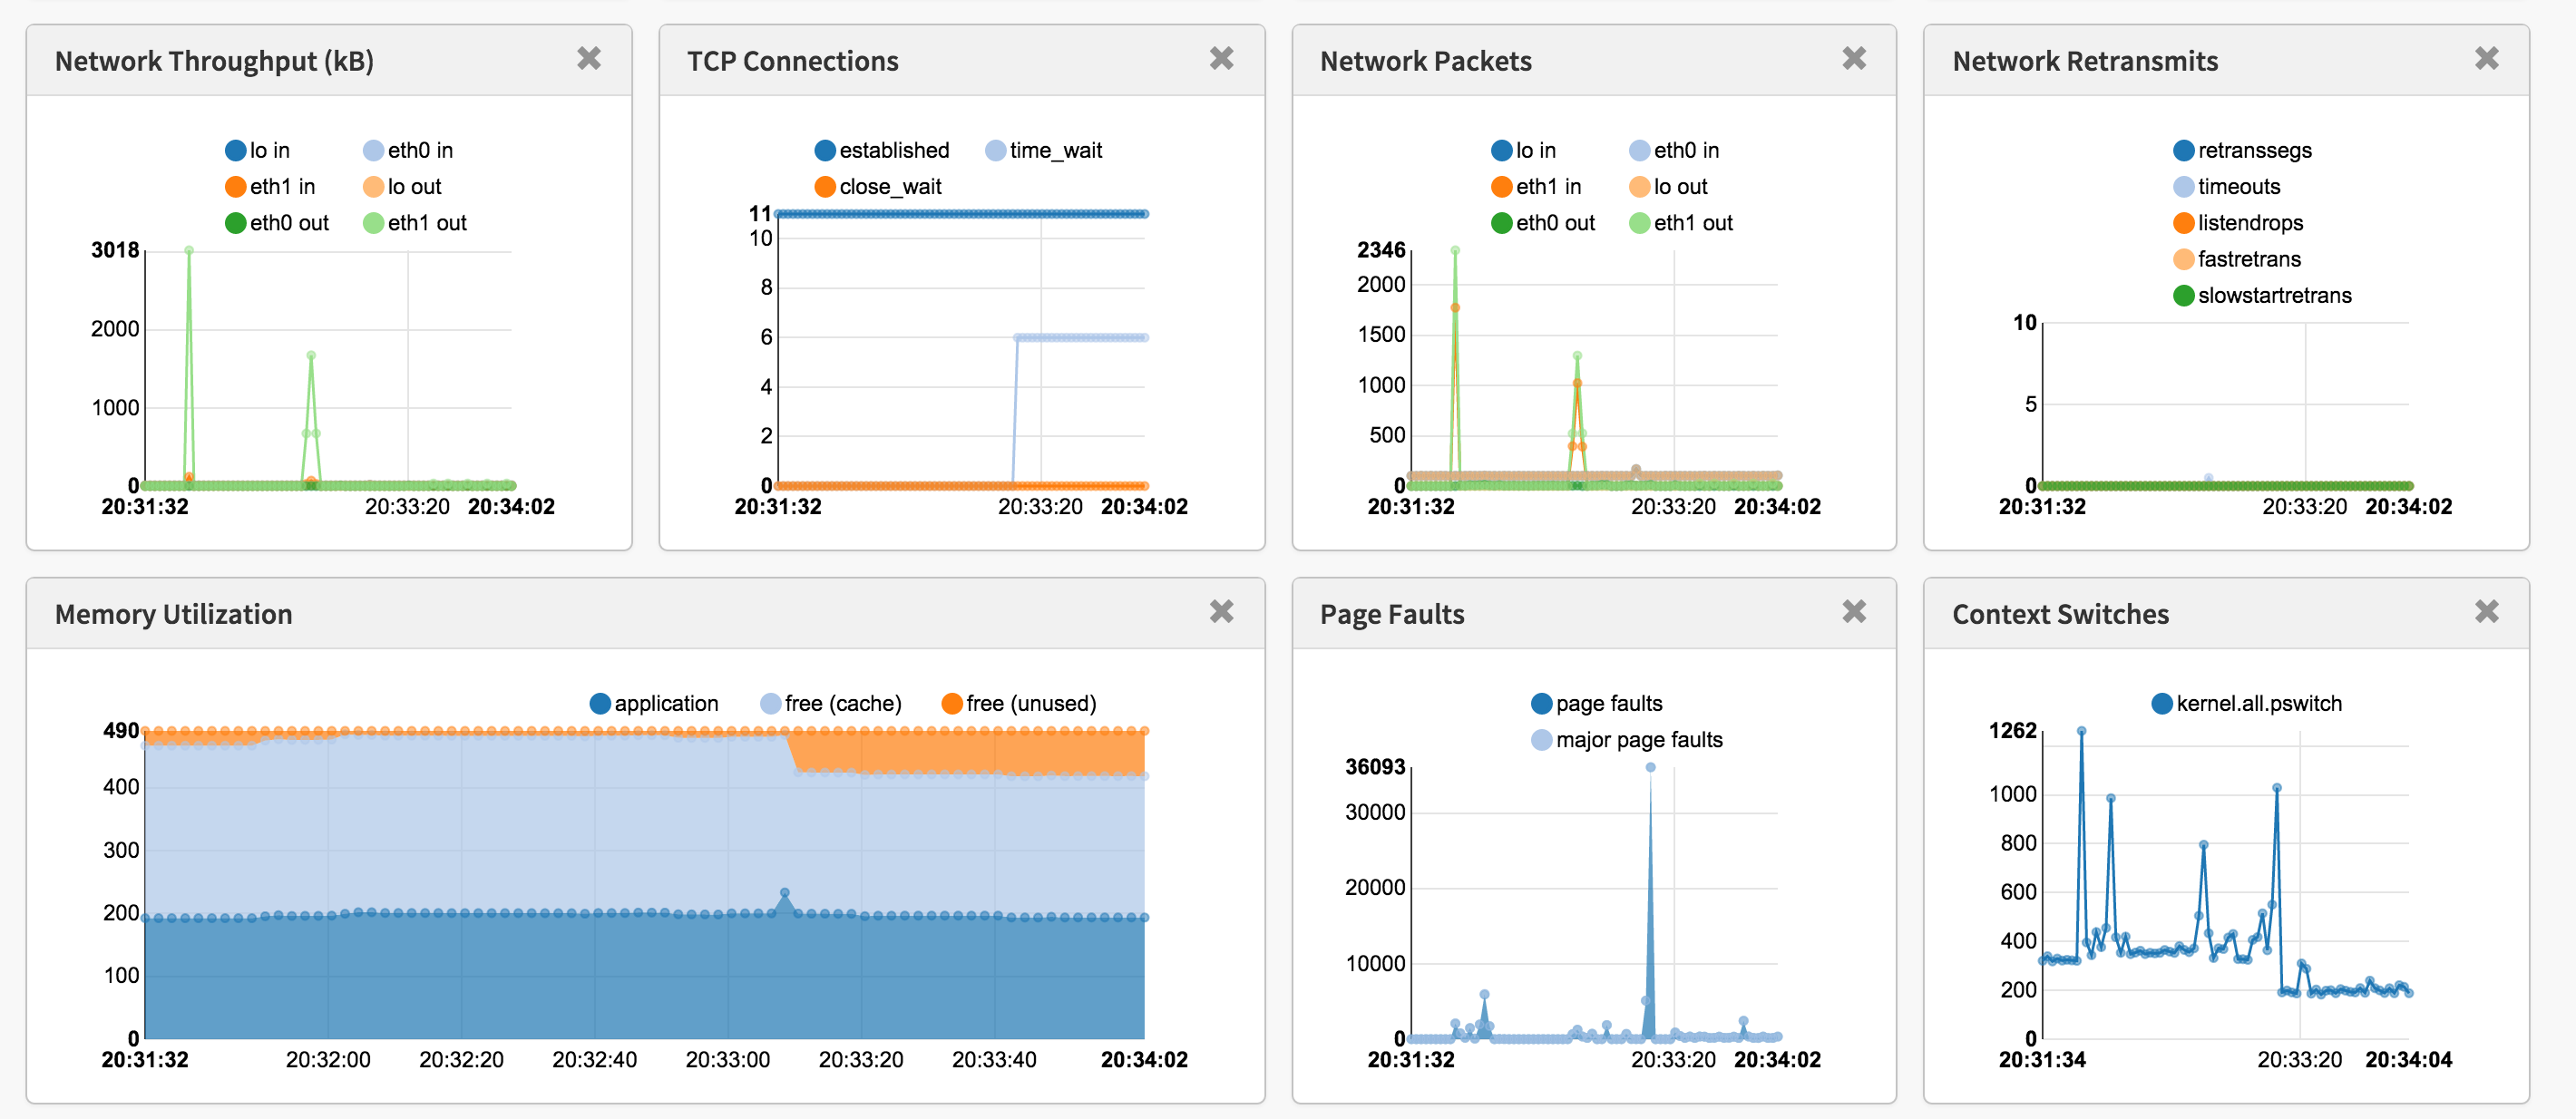
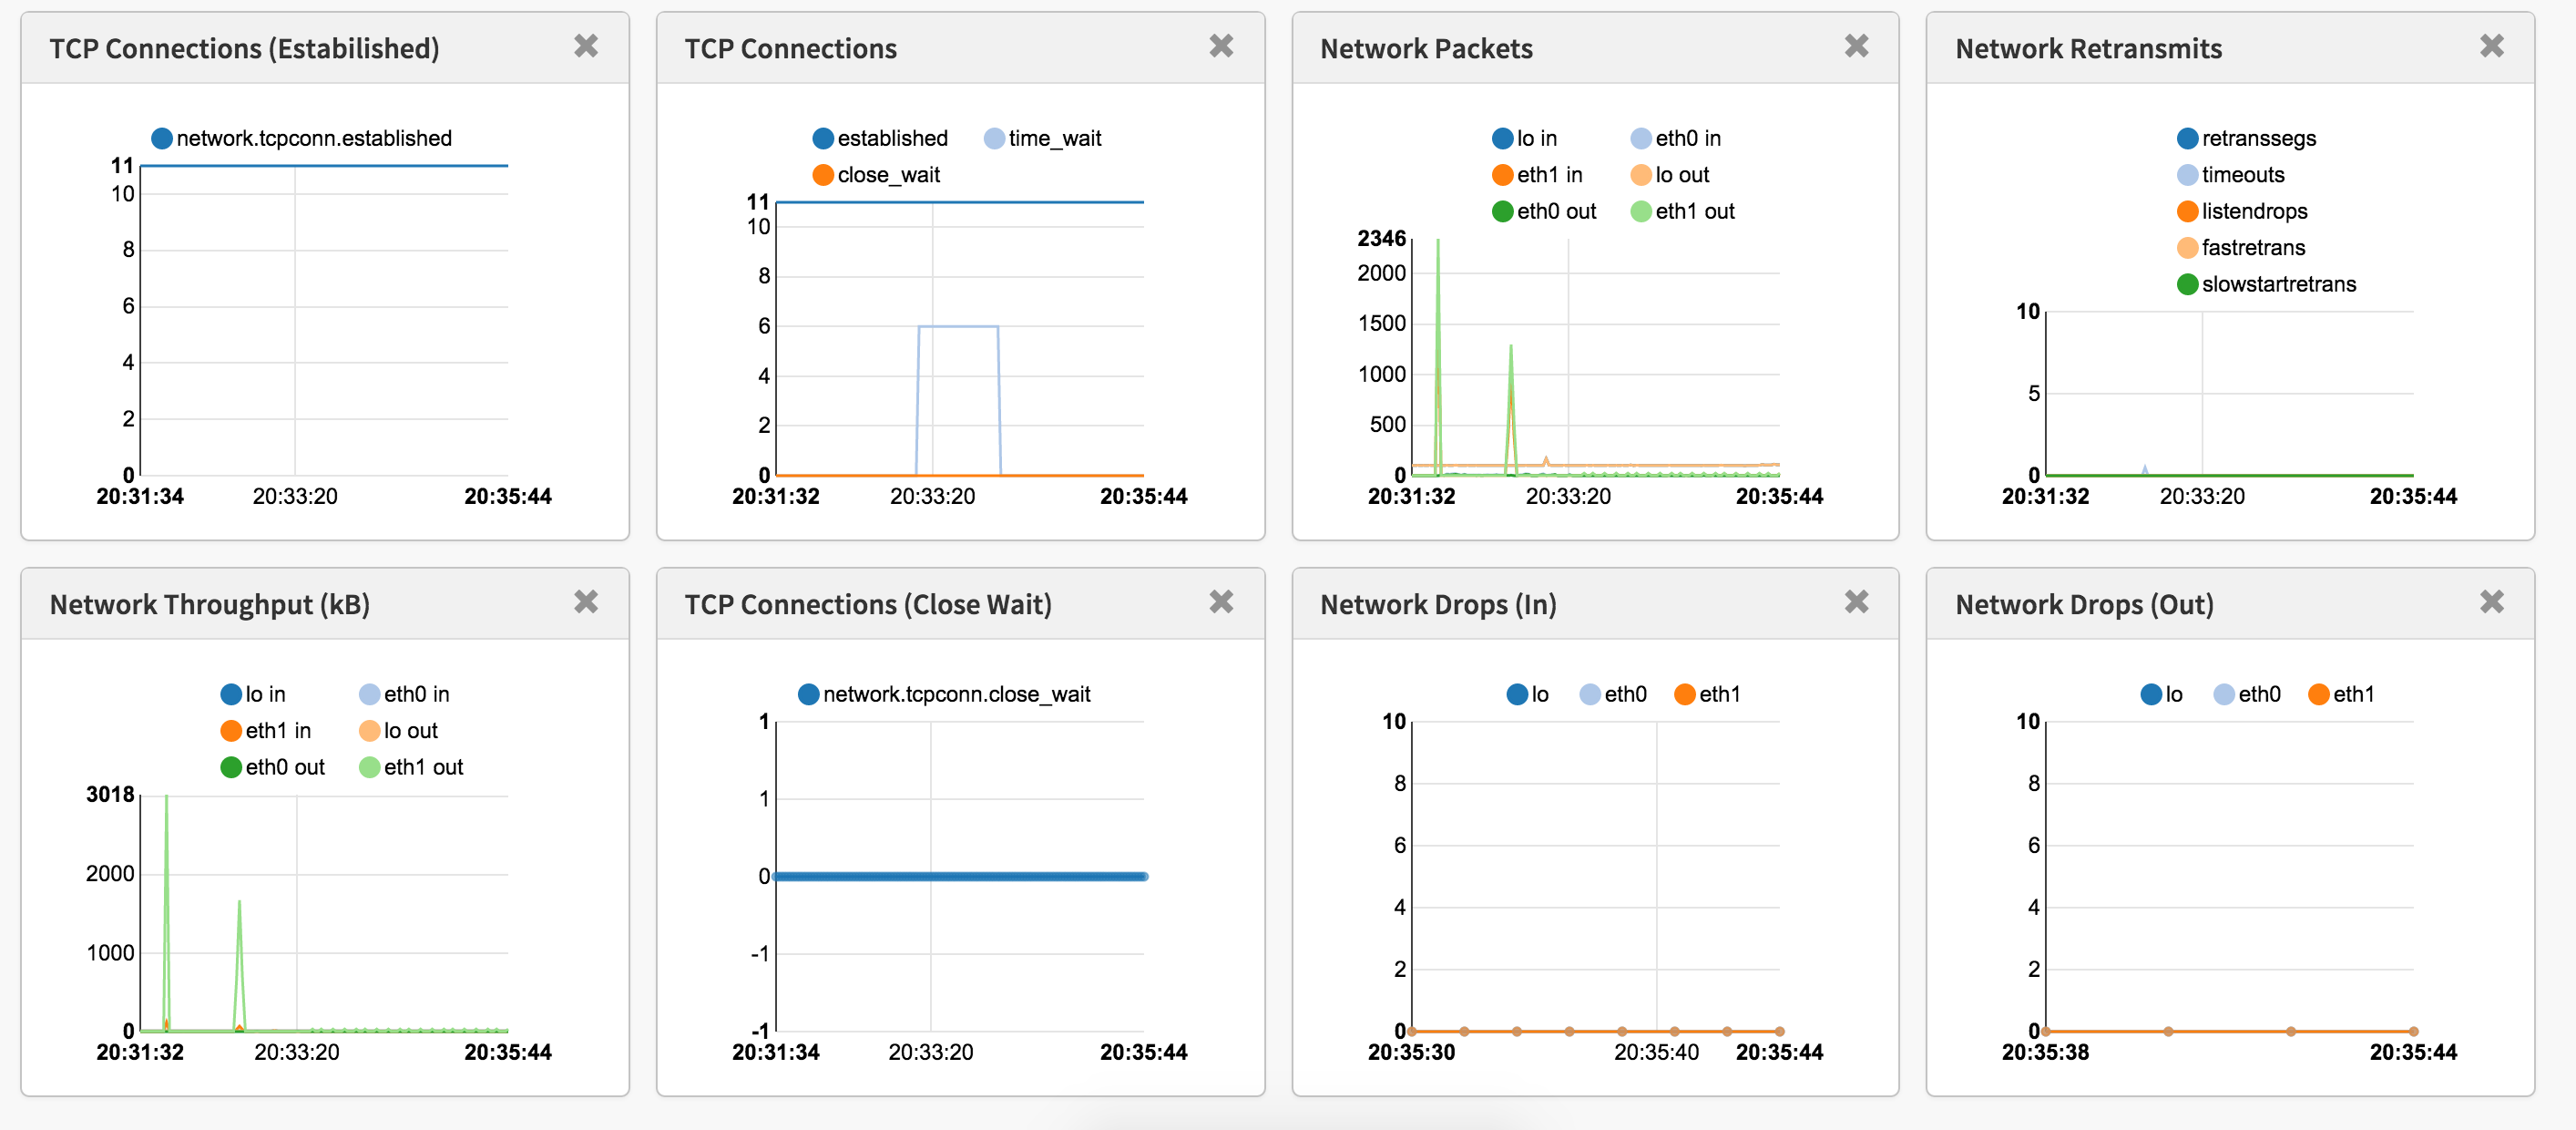
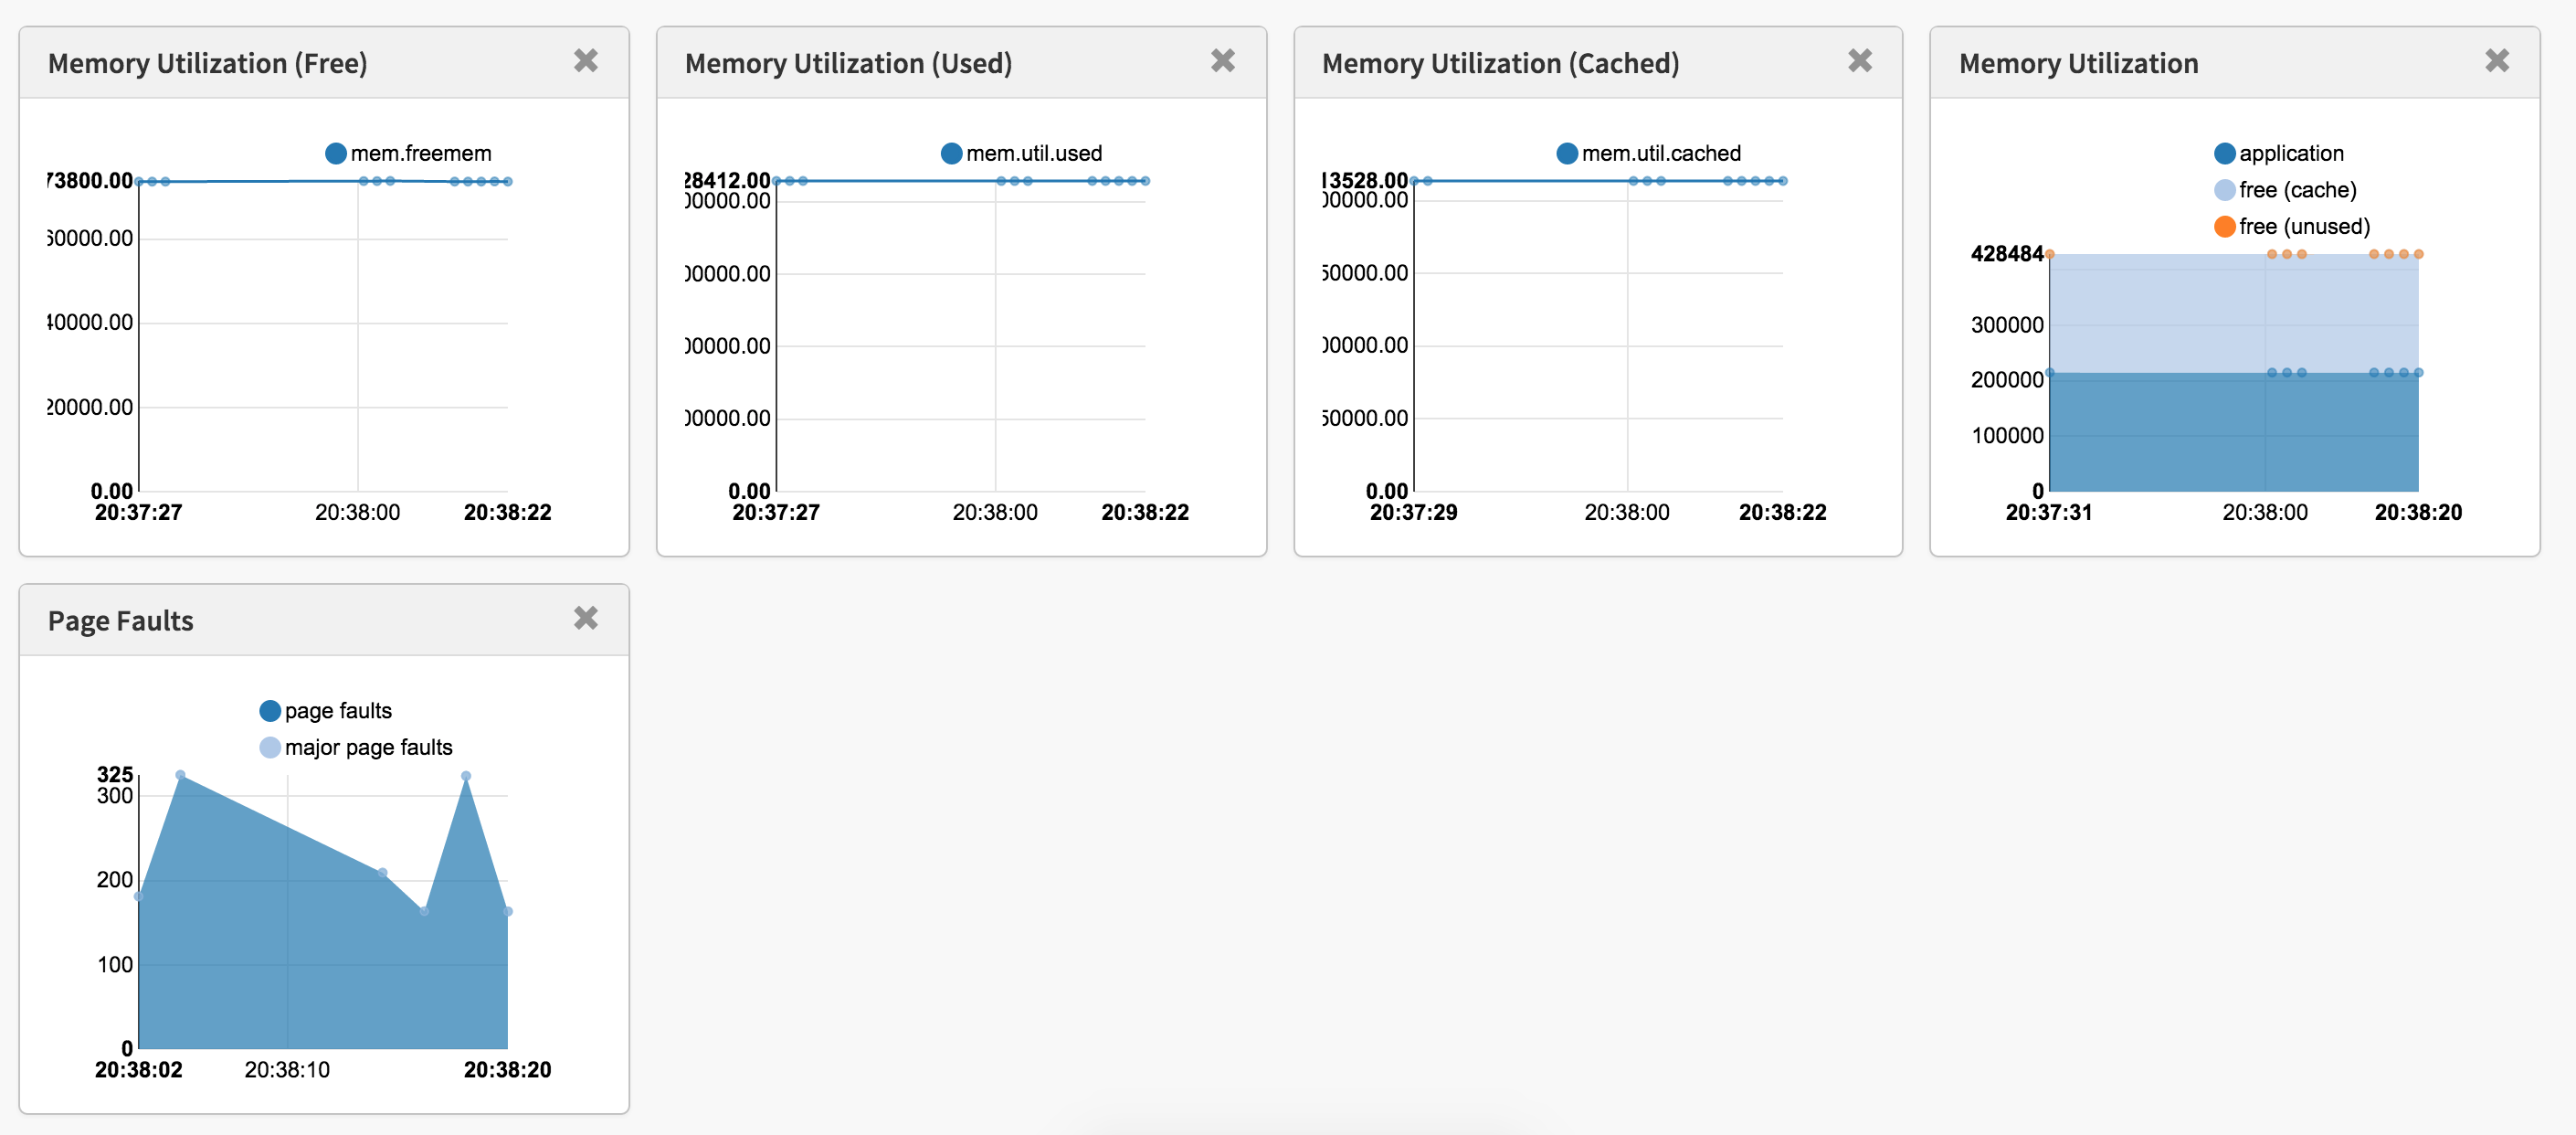
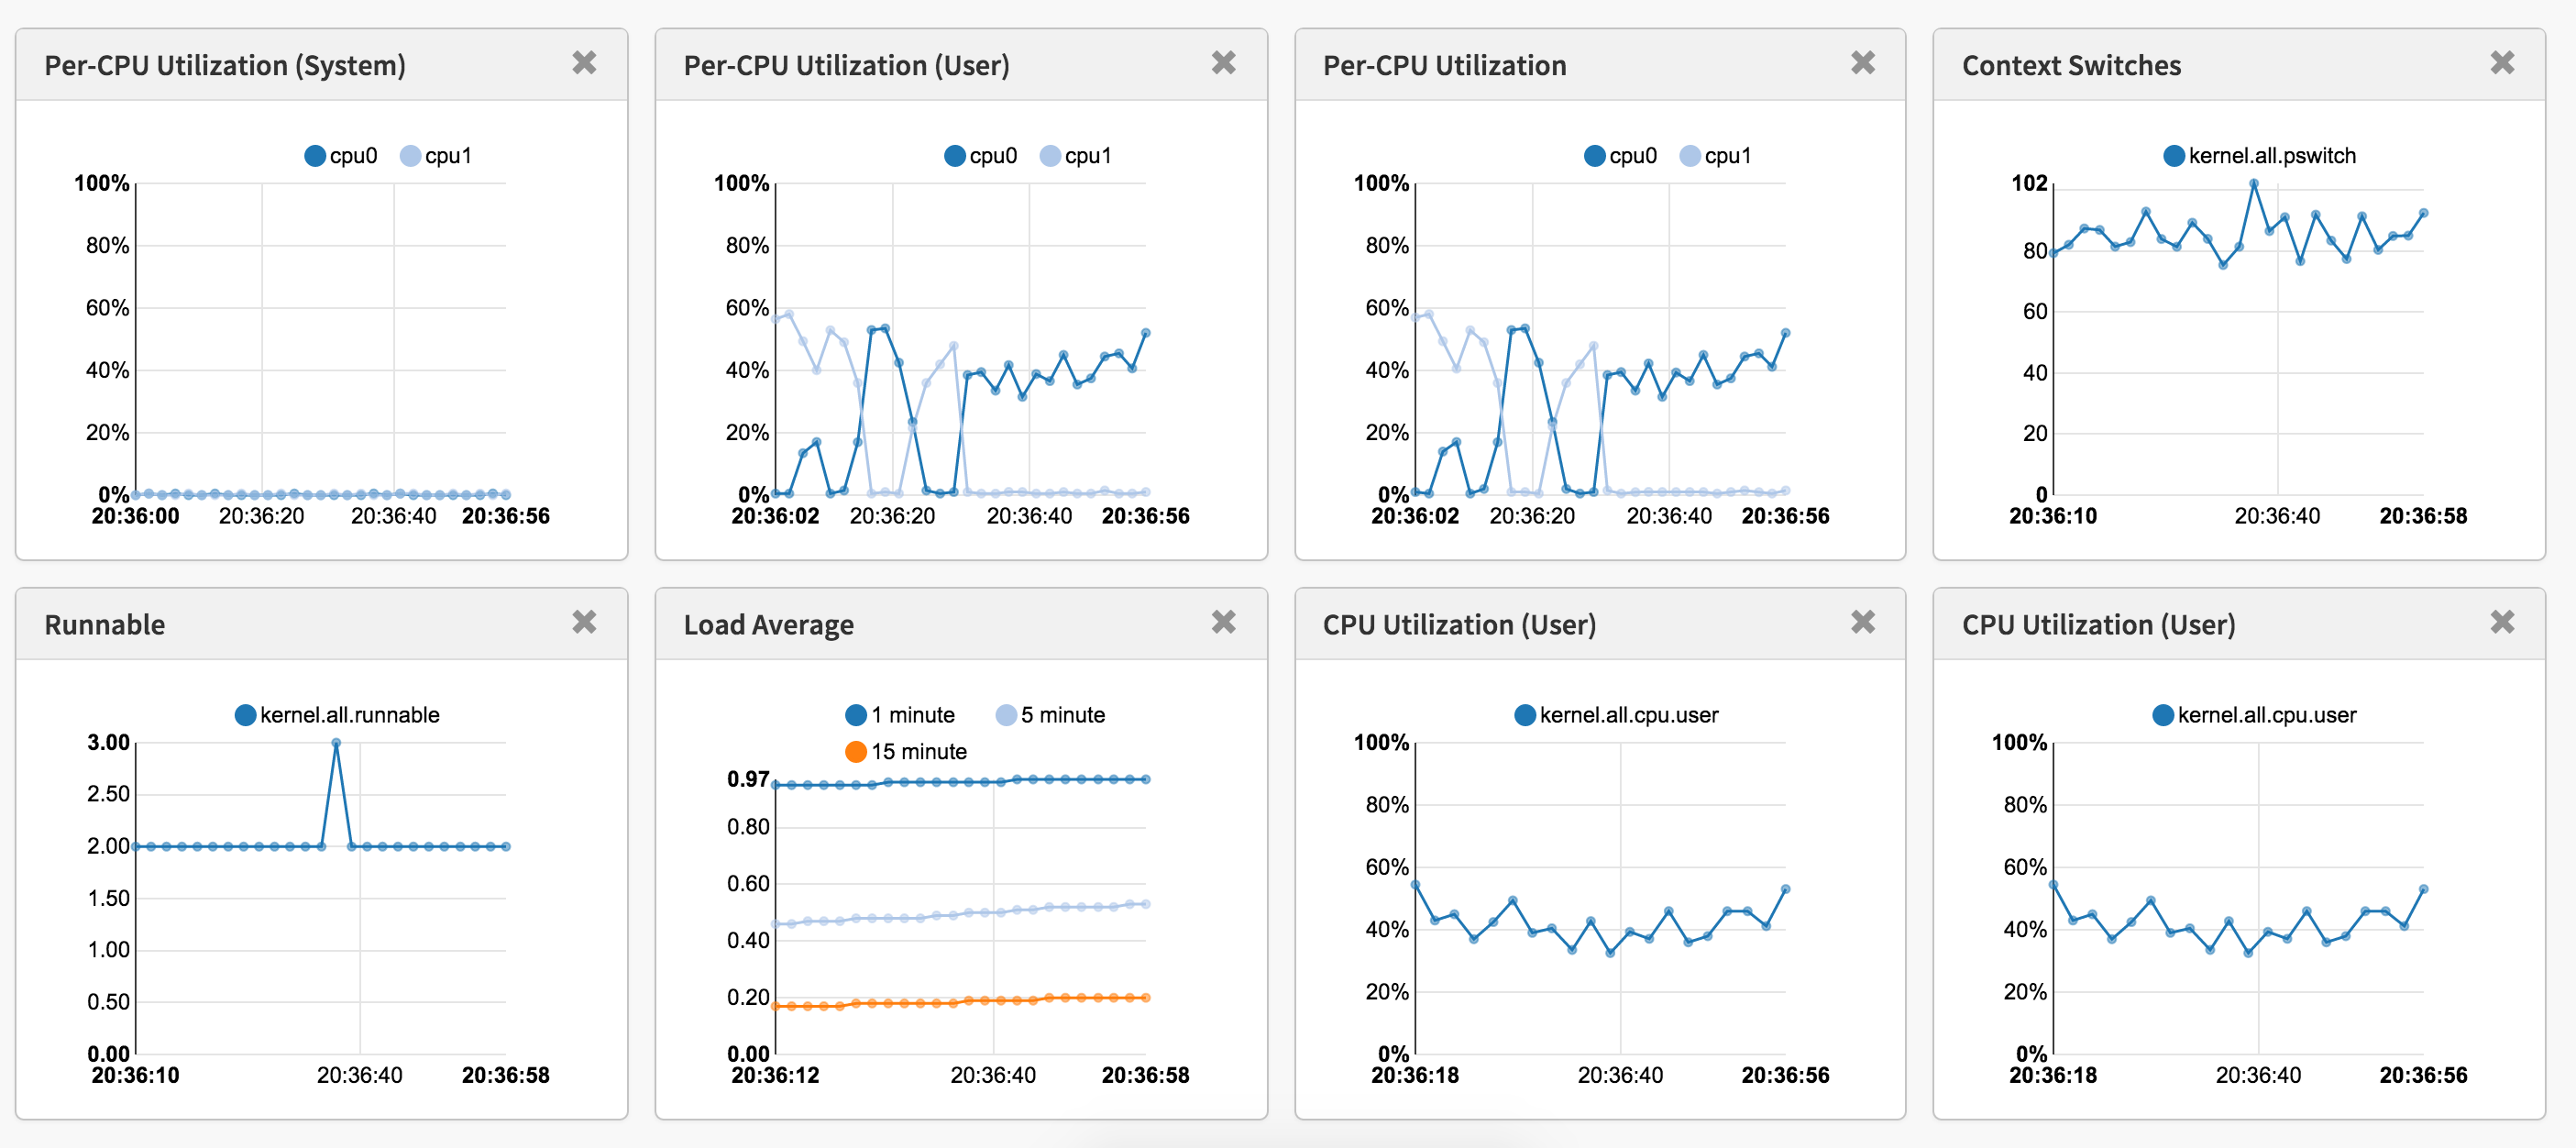
Here’s the default Dashboard as soon as you load the webapp. Click on each screenshot for a bigger version.
The current version of Vector has graphs for 4 major areas of the OS: Network, Disk, Memory & CPU.
Network
Disk
Memory
CPU
Next steps#
Their blogpost announcement hints to a few interesting “next steps” for the project. I particularly like the idea of having CPU Flame Graphs in an easily accessible UI!
The overhead of running PCP seems minimal, this may just be an additional tool for our managed hosting clients . More fine grained access to monitoring stats in a good looking WebUI for ad-hoc debugging. Sounds good to me!
Vector is definitely a tool to keep an eye on. You can follow the development process on Github; github.com/Netflix/vector .


