In this series, we are going to talk about Linux performance measurement, how to measure it right. Linux performance is a very broad topic, so we’ll focus on the four primary resources which are typically going to drive your system performance – obviously CPU, memory, disk storage, and network.
Other parts in this series include:
- Measuring Linux Performance: CPU
- Measuring Linux Performance: Disk
- Measuring Linux Performance: Memory
- Measuring Linux Performance: Network
Now when we speak about understanding the performance as related to those components, that does NOT mean that your CPU is a problem and you just need to go ahead and get more CPU. Your cloud vendors probably would exactly want you to do that, to do the tuning by the credit card.
But maybe that is not what you want to do, and you want to understand what’s actually causing the usage, and how you want to resolve it.
You at least need to understand where resource utilization comes from to that particular resource because that’s how you can change your application workload.
Queuing and Concurrency#
Now I think, another important thing to understand about resources, and we should go through a lot of questions here, is to understand that when you have resources, they have some sort of natural concurrency, with which we can execute the workload.
So, for example, if you look at your CPU, it probably has multiple CPU freq’s, CPU cores, which can execute more or less in parallel. But if you have more tasks within the CPU, they can be queued. If you have a spinning disk it also can execute only one I/O request at a time.
Your RAID volume or SSD can execute more of them at a time. But all of them have some sort of concurrency with which they can perform well, afterward queuing happens.
What is bad about queuing? Queueing adds to the execution time (Latency) and latency is exactly how your end-users experience performance.
If you want to learn more about the methodology, it applies not only to Linux but also other systems as well, I would suggest to check out this USE method – Utilization, Saturation, Errors.
LoadAvg#
Let’s start with some typical mistakes which you can see in Linux. I think one of our most common misconceptions is a load average. In so many cases I see that people are reading load average, maybe making some monitoring about that, and saying, “Oh, there is the magic number – if the load average is more than five, then that’s bad”.
I think that is a problem. For example, this server has quite a high load average, it’s floating between 40 and 60, but I can tell that the server has 80 CPU cores and it’s not really breaking a sweat.
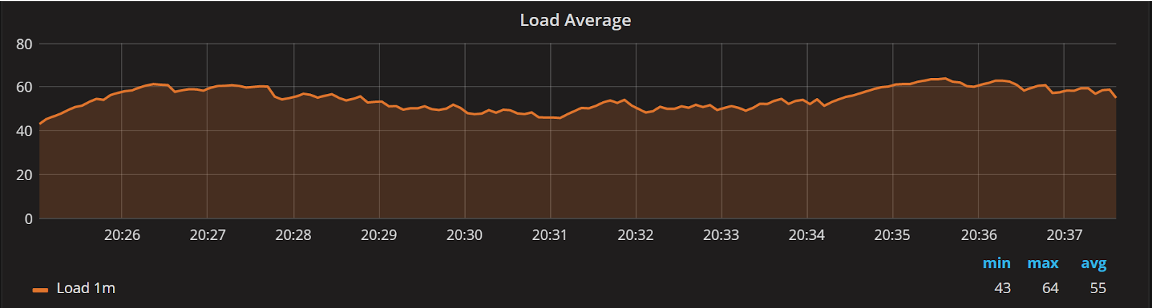
What can you tell me about this server load?
While the load average can be used to get some insight into your system, a lot of people do not really understand it and look at it as a magic number.
What kind of problems do we see with the load average?#
One is that it really mixes I/O and CPU usage together. You can have a very I/O-intensive workload and a very CPU-intensive one. They both may have a very high load average, so you don’t really quite know what it is.
It is not really normalized. As I mentioned, if you have a lot of CPU cores, and in these days, we’re operating a very interesting space where you can have VM spun out which have just one CPU core, or we can have production systems which have a hundred plus CPU cores, there are two orders of magnitude difference.
And it really means that they cannot use their “magic numbers” which we could when all the servers had one, two, or maybe four CPU cores just a decade ago or more. In those cases, load average 20 is kind of bad for everyone.
It’s not normalized, and it also has a lot of computational artifacts, especially in Linux. If you are interested in those computational artifacts, check this thing out from Brendan Gregg’s blog . He does all the fantastic work, and the Linux load average is one thing that he wrote about relatively recently.
Now, what I’d like to do at the very least is to separate the I/O loads and the CPU load. That is essentially the same load average but split out, and in this case, I can see, if I normalize my CPU load, it’s actually quite low, there is no waiting task, but there is some I/O fluctuation going on.
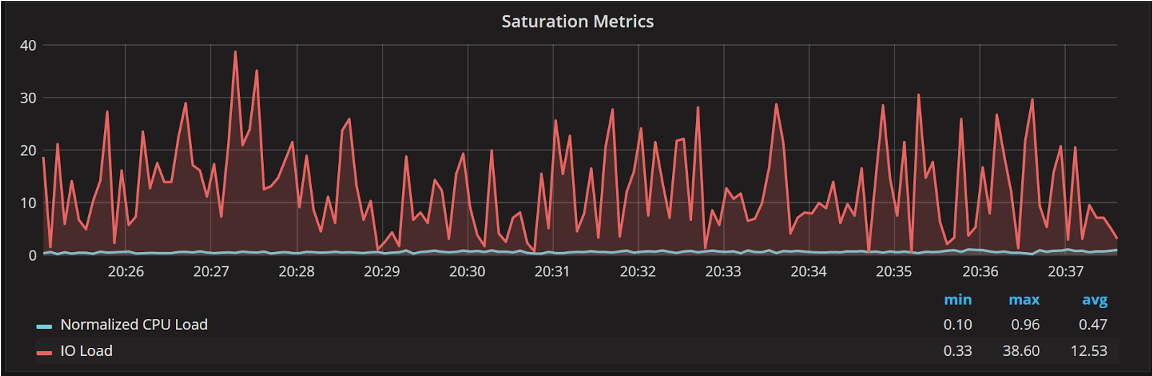
Graph from Percona Monitoring and Management (PMM )
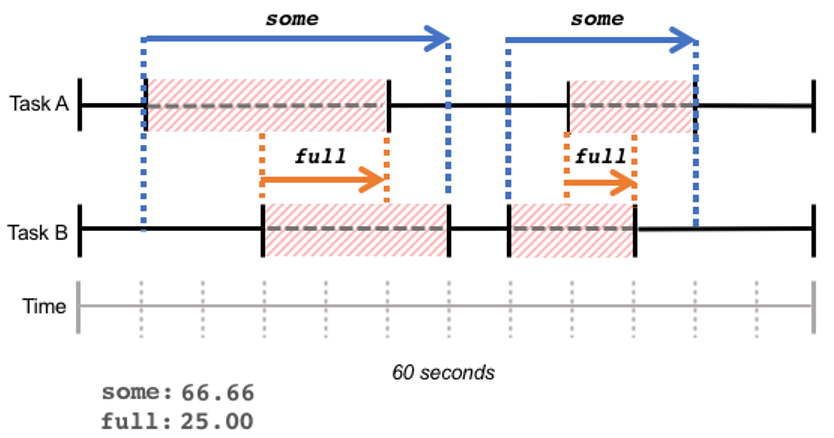
Pressure Stall Information#
An even better way to look at the CPU or/and some other resources utilization is PSI - Pressure Stall Information. When this was first written it was a new tool, only just landing in the kernels. It’s been mainline since kernel 4.20 (December 2018) and is now enabled by default in pretty much every modern distribution, so for practical purposes it’s available to you today (if it isn’t, boot with the psi=1 kernel parameter).
It allows us to really understand from the latency standpoint what a given task is being blocked by and when it’s being blocked by a vacant CPU run queue, by waiting on disk I/O, or because of memory pressure.
It gives us very good information about the performance and how it impacts the end-user, instead of focusing on some “magic numbers”, which people often want to do. And again, here’s a URL with more information available.
eBPF#
What you can do right now, and which is fantastic for monitoring, is to use eBPF. There are a number of ways you can use and consume that information, for example, there is a Cloudflare Exporter, where you can get that information to Prometheus for monitoring.
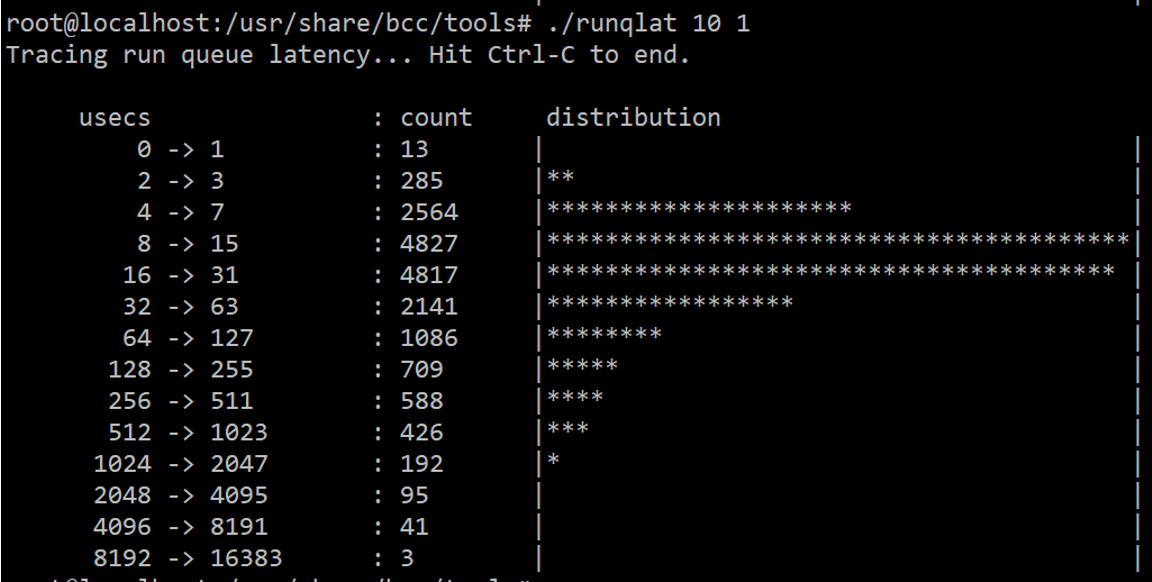
Here is a little command-line tool from BCC tool collection, where you can actually look at the run queue latency, or how much it takes before the task is scheduled on a CPU.
If it’s scheduled almost immediately, then that means there was a CPU available, it wasn’t waiting long, whatever your kind of CPU usage graphs or whatever are showing you. And if it’s high, then it was not scheduled for a long time.
In this case, a good thing is that they take care of some complicated cases, which CPU usage alone is not going to show you. For example, Linux CPU scheduler is a complicated beast, especially in NUMA environments.
So whatever logic it does, if it just takes a long time to schedule, your user will be impacted. You won’t see that in the CPU utilization graph, but you will see that in round-queue latency information.
Now it is another mistake. This is an example from Prometheus, which obviously tells us the different nodes of the CPU usage.
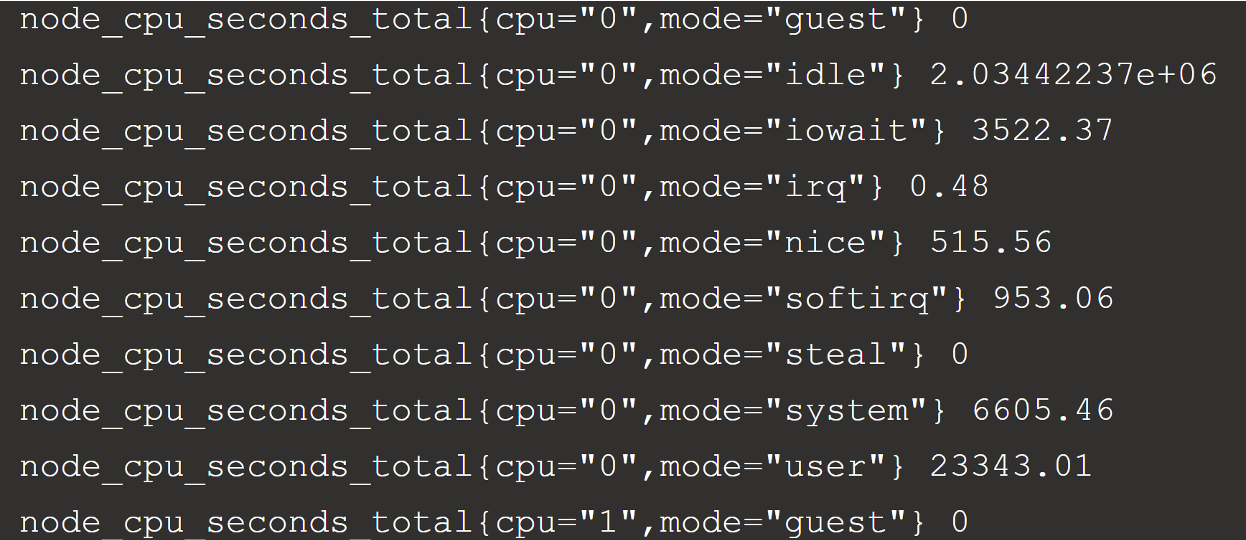
Which of these correspond to CPU being used?
You can see many of them here. Which of them really corresponds to the CPU being used here? I have seen a lot of graph recommendations on the Internet and can say, “Oh, let’s run its query and everything which is not idle is CPU-used”.
This is not really the case because of at least two important misconceptions:
1. iowait is idle#
From a CPU standpoint, the CPU is idle when it’s in a kind of iowait state.
Yes, it was decided for convenience to add another state for that ‑ idle when there is no disk I/O going on, and idle when there is disk I/O going on.
But from a CPU standpoint, if you have a system which shows 99 CPU in I/O state, it’s not CPU bottleneck, it’s an I/O bottleneck.
2. steal is CPU not available to this VM#
In VM environments and some cloud environments, steal corresponds with CPU which is not really used by your application on anything you are doing in your.
It refers to your neighbors’ VM. Since CPU’s get shared in virtual environments, another VM may be stealing CPU cycles away from you on the same CPU core.
More CPU fun#
There is even more fun when it comes to understanding CPU performance. So, for example, modern CPUs change their frequency with the load. Sometimes it might be as much as 5x.
Also, Peak Core Frequency which the system can provide depends on the load - in particular, the load you are running on one core - and the number of cores used.
And not to mention that virtual cores are not the same in terms of real cores.
Now in this case from the utilization standpoint, if your CPU use is close to saturation, you will see that everywhere.
But it is important to understand for capacity planning, because if you know your application scales linearly with the workload, and you can see that your CPU usage is only five percent, you could probably guess you can get at least 20x the growth on your application.
That may not be the case with the complicated math which is going into how CPUs scale these days.