In this series, we are talking about Linux performance measurement, how to measure it right. Linux performance is a very broad topic, so we’ll focus on the four primary resources which are typically going to drive your system performance – obviously CPU, memory, disk storage, and network.
Other parts in this series include:
- Measuring Linux Performance: CPU
- Measuring Linux Performance: Disk
- Measuring Linux Performance: Memory
- Measuring Linux Performance: Network
In terms of the disk, there are actually two things you have to take care of:
- Disk space – simple, right? You don’t want to run out of disk space.
- And disk as I/O performance.
Disk Space#
Starting from the simple tool – disk space.
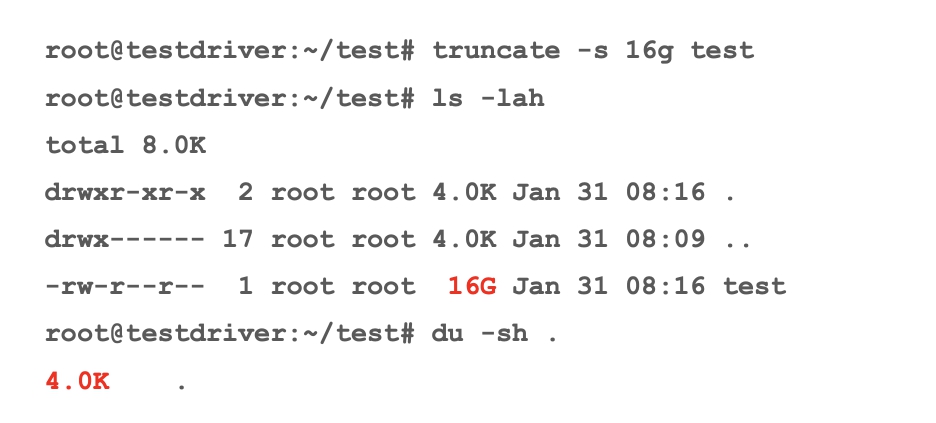
I see a lot of people who do not understand the difference between size, the file length, and the disk usage. So, in this case, I created a test file of 16 gigabytes, but if you look at du, it only takes 4 kilobytes, because that is a sparse file, which is one giant 16-gigabyte hole.

Of course, you’re not likely to see this kind of a difference in the real world but you can, because there are a number of systems using sparse files for different things.
For example, in MySQL, due to some of the table compression that is used there may be a big difference between disk space used vs. file length that may be substantially different.
I/O performance#
Now when you speak about the disk I/O performance standpoint, you need to consider a number of things here.
Obviously, there is IOPS - how much it can do in the bandwidth. They are not quite replaceable, both can be the bottleneck, especially when it comes to the network-attached storage or slower buses. For example, it can be noticed that all SATA SSDs exactly deliver 500 megabytes a second because the SSDs are so fast, but SATA buses are so slow in this case, so that is the limit out there.
You also need to understand the different types of loads the disk reads, writes, or fsyncs , because we do have different latency and load implication.
In addition, your load concurrency is often referred to as a Queue Depth when it comes to the disk because concurrency is how many requests the system can process in parallel when big throughput is achieved that it is actually typical.
So, from typical mistakes: “My Iostat Disk Utilization number has reached 100%”. I have seen so many times this kind of being so much scared about this 100% when “there is no way to go! Oh my gosh!”
The reality is that your iostat utilization number means the percent of the time when at least one I/O request was outstanding. It may make sense again for a single spinning drive in the last decade or last millennia, but it doesn’t really make sense for common storage we use those days.
It does not make sense for SSDs, it doesn’t make sense for RAIDs, it doesn’t make sense for NAS, it doesn’t make sense for cloud storage because they are very good at processing multiple requests at a time.
Performance, the latency at least, would not be impacted.
The points that should be highlighted here:
1. Separating read and write latency#
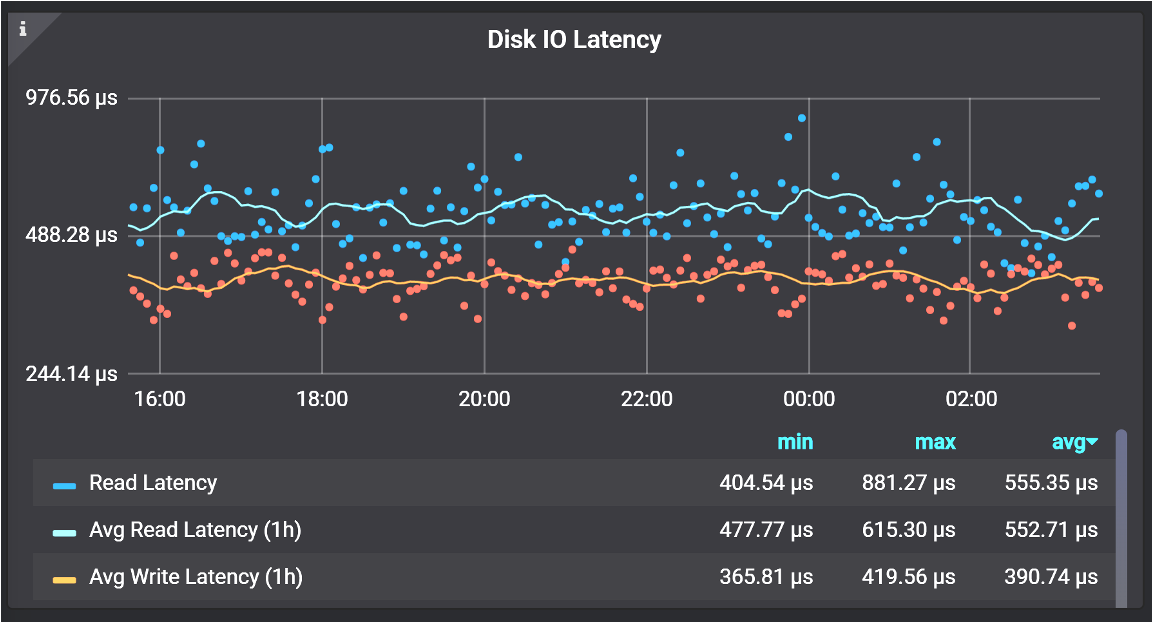
Depending on your system, the difference between read and write latency may be very significant. Some systems actually have varied read latency, some have better write latency. In this case, what I do is compare their current latency to their kind of average latency, which you’ve seen on this system over the last period of time, so I can understand relatively easily that it’s abnormal.

Comparing Current Latency to Historic Latency can help to see when the latency is abnormal
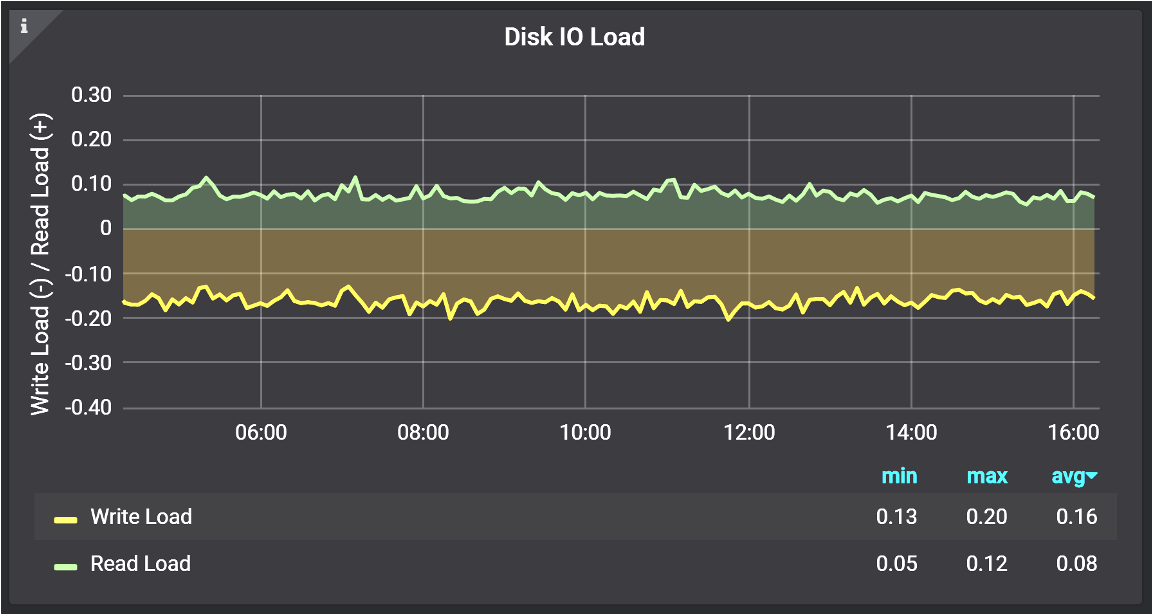
2. The disk load, that also can be the average disk use#
It means how many requests are going on at the same time. Because if you’re really saturating your disks, queuing happens, and when this thing typically becomes quite high you should know what exactly your storage is expected to be able to optimally handle.
The problem is of course if you think about cloud storage, you don’t really know what the optimal concurrency is. They don’t tell you and that’s going to be implementation-dependent, which can change at any point any time.

Graph from Percona Monitoring and Management (PMM )
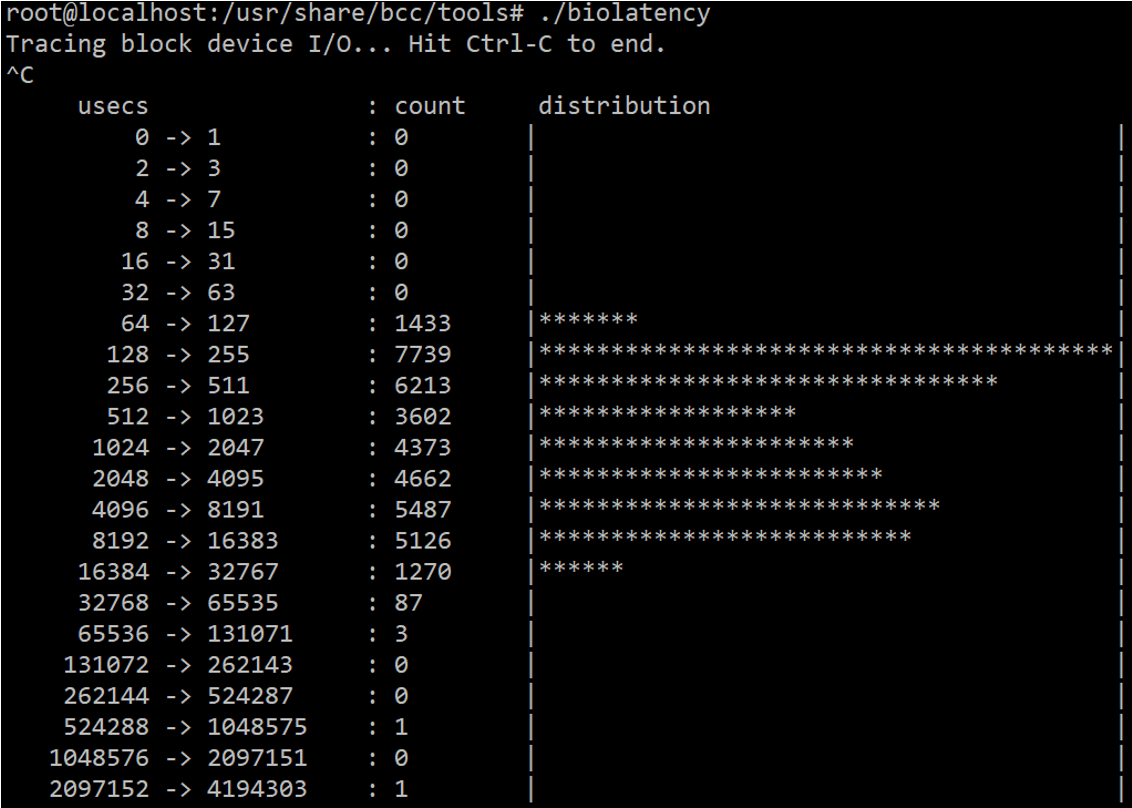
3. Biolatency: Block Device Latency#
The next thing is a biolatency, which again you can get from eBPF. You do not need to look at just the average latency, you can look at the distribution which can be done on an I/O device.

eBPF also has some tools where you can look at that on a file system level that is more interesting because that is where you can also see your cache efficiency as well as you can look at some more of the outliers.
So, this is the tool for ext4 and also one for XFS and some other common file systems.